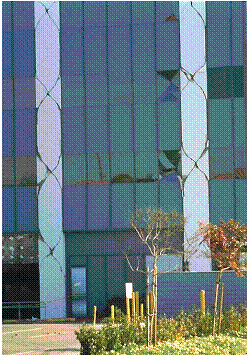
THE DETERMINATION OF DAMAGE AND DAMAGE INDICES FOR REINFORCED CONCRETE BEAMS DESIGNED TO 1972 MINISTRY OF WORKS DESIGN CODES
By
Nicholas Gulley
James Bilkey
James Stewart
Ben Dare

Foreword
The work that needed to be undertaken during this project was too large to be completed by a single student for their forth year project. This has meant that this project has been completed by four students, James Bilkey (JB), Ben Dare (BD), Nicholas Gulley (NG) and James Stewart (JS) as part of a combined 4th year project. All of the work including the designing and building was completed as a group. Each individual conducted a quarter of the testing program that was required. The analysis of the laboratory data was undertaken using a range of spreadsheets developed as a group. Each person has written a section of the report along with writing up their own results. This is detailed in the table of contents with the author in brackets. This project was conducted under the supervision of Dr Barry Davidson.
Technical Abstract
Currently there is no prescribed method for determining the amount of damage sustained by a reinforced concrete structure designed to pre 1972 New Zealand design standards during an earthquake. One of the key features of these designs is the amount of shear damage that is observed and the lack of knowledge today, in assessing and repairing this form of damage. For the assessment of damage sustained by a structure during an earthquake it is necessary to establish a relationship between the observed damage and the actual remaining strength. A large number of damage indices have been prescribed by researchers throughout the world in an attempt to quantify a prediction of the state of damage a structure has sustained. Twelve different loading histories were applied to twelve nominally identical beams to categorise a quantitative method for the comparison of observed damage sustained with the remaining strength. It was established that there was a substantial difference between the calculated nominal shear strength and the actual strength obtained during testing. It was also established that no prescribed damage index was able to consistently predict the damage sustained during the testing stages. Four damage states have been prescribed to enable the categorisation of observed damage into various levels of damage. Criteria for identifying each damage state has also been developed from comparison of the test results.
Acknowledgements
There are many people that we would like to thank for assisting us in the construction, testing, analysis and report writing that was involved in completing our project.
Firstly, we would like to thank Dr. Barry Davidson for supervising this project and providing us with ever useful advice, which was greatly appreciated. We would also like to thank Les Megget for helping us with the technical aspects of our beam design. Thanks also to Hank Mooy, Tony Daligan and Mark Byrami for helping with the construction and testing.
We would like to thank Pacific Steel and Allied concrete for supplying the materials, without which this project would not have been completed.
Finally, we would like to thank all of our friends and family for supporting us during this project. Your support has helped us to complete this project on time and finish our degrees.
Table of Contents
2.0 Literature Review (NG) 2-1
2.1.1 Cumulative Ductility. 2-2
2.2 Roufaiel and Meyer (1987) 2-2
2.2.1 Comparison by Liddell (2000) 2-4
2.2.2 Comparison by Williams et al. (1997) 2-4
2.2.3 Comparison by Ghobarah et al. (1999) 2-5
2.3 Development of the Park and Ang Damage Index. 2-5
2.3.1 Comparison by Williams et al. (1997) 2-8
2.3.2 Comparison by Cosenza et al. (1993) 2-9
2.3.3 Comparison by Kunnath et al. (1997) 2-10
2.4 Banon and Veneziano Index. 2-12
2.5 Cosenza et al. (1993) Index. 2-12
2.6.1 Comparison by Liddell (2000) 2-13
2.6.2 Comparison by Williams and Sexsmith (1995) 2-14
2.7 Chung, Meyer and Shinozuka Damage Index. 2-14
2.8 Damage index by Kunnath et al. (1992) 2-17
3.1 Earthquake Reinforced Concrete Structures. 3-1
3.1.1 Current Performance Criteria. 3-1
3.1.2 Current Design Methodology for Ultimate Limits. 3-2
3.3 Measuring Observed Structural Damage. 3-6
3.4.1 Components of Displacement 3-6
3.4.1.1 Shear Displacement 3-7
3.4.1.2 Flexural Displacement 3-8
3.4.1.3 Rocking Displacement 3-9
3.4.1.4 Calculated Displacement 3-9
4.0 Test Assembly Design, Construction, and Set-Up (BD) 4-1
4.2.1 Design/Loadings Codes. 4-3
4.2.2.1 Longitudinal Reinforcement 4-5
4.3.1.1 Steel Reinforcement 4-8
4.3.2 Construction Sequence. 4-13
4.6 Separate Displacement Components. 4-19
5.0 Applied Loading Histories (JS) 5-1
5.1 International Standard Loading Histories. 5-1
5.1.1 Conventional approach from New Zealand. 5-1
5.1.2 Conventional approach from the Public Works Research Institute in Japan. 5-3
5.1.3 Conventional approach from the PRESSS Research Programme. 5-4
5.1.4 Conventional approach from the University of California at Berkley. 5-4
5.2 Fabricated Loading Histories. 5-5
5.2.2 Bi-directional Cycling at Ductility 3. 5-6
5.2.3 Uni-directional Cycling. 5-7
5.3 Earthquake Loading Histories. 5-7
5.3.1 Earthquake Loading History A.. 5-8
5.3.2 Earthquake Loading History B.. 5-9
5.3.3 Earthquake Loading History C.. 5-9
5.3.4 Earthquake Loading History D.. 5-10
5.3.5 Earthquake Loading History E. 5-10
6.1 New Zealand Loading History (NG) 6-2
6.2 Public Works Research Institute (JB) 6-5
6.4 Berkeley Loading History (JS) 6-9
6.5 Monotonic Lading History (BD) 6-12
6.6 Bi-directional Cycling at Ductility 3 (JB) 6-15
6.7 The Uni-directional Cycling Test (NG) 6-17
6.8 Earthquake Loading History A (BD) 6-19
6.9 Earthquake Loading History B (JB) 6-21
6.10 Earthquake Loading History C (BD) 6-23
6.11 earthquake Loading History D (JS) 6-26
6.12 Earthquake loading History E (JS) 6-28
7.0 Comparison of Results (NG, JB, JS, BD) 7-1
7.1 Comparison of the Laboratory Loading Histories. 7-1
7.1.1 Failure Load and Displacement 7-2
7.2 Comparison between the Laboratory tests and the Earthquake Loading Histories. 7-3
7.2.1 Failure Load and Displacement 7-4
7.3 The Ability of Damage Indices to Reflect Failure. 7-5
7.3.5 Banon and Veneziano. 7-7
7.3.6 Summary of Damage Indices. 7-7
7.4 The Ability of the Damage Indices to Reflect Observed Damage. 7-7
7.5 Other Methods to Reflect Observed Damage. 7-7
8.0 Conclusions (NG, JB, JS, BD) 8-1
8.3 Comparison of results. 8-2
Appendix A: Results and Analysis. A-1
A-1 The New Zealand Loading History. A-2
A-2 Public Works Research Institute Loading History. A-8
A-3 The PRESSS Loading History Test A-14
A-4 The Berkeley Loading History Test A-20
A-6 Cycling at Ductility 3. A-33
A-7 The Uni-directional Cycling Loading History. A-39
A-9 Earthquake A Loading History. A-45
A-10 Acceleration B Loading History. A-52
A-11 Earthquake C Loading History. A-58
A-11 Acceleration History D.. A-65
A-12 Acceleration History E. A-71
List of Tables
Table 2-1: Park and Ang Damage Classification Levels (Singhal and Kiremidjian 1995). 2-7
Table 2-2 Bracci et al. Damage Classification Levels. 2-13
Table 2-4: Typical Range of Values for ß. 2-18
Table 2-5. Damage Condition and corresponding Limiting Damage Indices (Stone and Taylor, 1993) 2-19
Table 4-1 Concrete Mix Design for batch one. 4-12
Table 4-2 Concrete Mix Design for batch two. 4-12
Table 5-1 Summary of Earthquake Loading History Design Factors. 5-8
Table 7-1 Crack widths and Increase in Depth for Standard Laboratory Tests at Failure. 7-3
Table 7-2 Crack widths and Increase in Depth for Earthquake Loading History Tests at Failure. 7-5
Table 7-3 Criteria for damage states. 7-9
List of Symbols
+ Positive or an up load cycle
- Negative or an down load cycle
a Calibration factor, usually 1.1
b Calibration factor, usually 0.38
![]() Strength damage
Strength damage
![]() Damage potential
Damage potential
![]() Deformation damage
Deformation damage
![]() Distance between the centre of this gauge group and the centre of the actuator
Distance between the centre of this gauge group and the centre of the actuator
dE Incremental dissipated hysteretic energy.
Ec(d) Hysteretic energy per loading cycle at deformation equal to, d.
Eh Dissipated energy
ET Dissipated hysteretic energy
![]() Elongation of gauge group
Elongation of gauge group
Fy Yield strength
![]() Height of gauge panel
Height of gauge panel
I Indicator of different displacement or curvature levels
J Indicator of cycle number for a given load level i
l/d Shear span ratio (taken as 1.7 if l/d < 1.7).
Mm Moment capacity of a section associated with the failure strain em
Mult Maximum moment recorded under monotonic loading
Mx Moment as the test progresses
My Yield moment
![]() : number of cycles (with curvature level i) to cause failure
: number of cycles (with curvature level i) to cause failure
n0 Normalized axial stress (taken as 0.2 if n0 < 0.2).
nij Number of cycles (with curvature level i) actually applied
pt Longitudinal steel ratio, as a percentage (taken as 0.75% if pt < 0.75%).
?w Confinement ratio.
Qy Calculated yield strength (Qy is replaced by the maximum strength, Qu, if Qu is smaller than Qy).
![]() Elastic Horizontal Inertia Force
Elastic Horizontal Inertia Force
![]() Ductile Horizontal Inertia Force
Ductile Horizontal Inertia Force
![]() Width of gauge panel
Width of gauge panel
aij Damage accelerator
ß Non-dimensional, non-negative parameters to take into account the effect of cyclic loading. (for Park and Ang)
ß Strength degrading parameter (for Kunnath et al.)
![]() Flexural Displacement
Flexural Displacement
![]() Rocking Displacement
Rocking Displacement
![]() Shear Displacement
Shear Displacement
![]() Ultimate Horizontal Displacement
Ultimate Horizontal Displacement
dbBond slippage deformation
deElastic shear deformation
dfFlexural deformation
dmax Maximum deformation experienced during loading.
dsInelastic shear deformation
du Ultimate deformation experienced under monotonic loading.
dyYield deformation
![]() Curvature
Curvature
Øm Curvature associated with the moment Mm
Ømax Curvature associated with the maximum recorded moment from testing
Øult Curvature associated with the maximum moment measured during monotonic loading
Øx Curvature associated with Mx
Øy Curvature associated with the yield moment
µu Amplifying ductility factor
µ Ductility
![]() Gauge group angle
Gauge group angle
?m Maximum rotation attained during loading history
?r Recoverable rotation at unloading
?u Ultimate rotation capacity of the section
![]() Rotation of gauge group
Rotation of gauge group
1.0 Introduction (JS)
When a structure experiences a severe earthquake the damage caused to the structure depends on the magnitude and direction of the ground excitation and the dynamic and nonlinear characteristics of the structure. The standard of design and construction will then have a direct relation to the damaged and remaining available strength of a structure after an earthquake. Due to the extent of advancement in knowledge of structural engineering, standard codes are regularly updated, allowing the design of more reliable structures which will in turn perform better than an older designed structure in a similar earthquake. Therefore the prediction of damage and available strength from visual defects of a structure designed to a more recent standard is becoming increasingly separated from that of a structure designed according to an older standard.
To overcome this problem, researchers have developed damage indices as a quantitative way of measuring the damage sustained by a structural member during an earthquake. This way of quantifying damage can be applied to any structure no mater what the design and gives an acceptable level of damage generally ranging from undamaged to irreparable.
In New Zealand today there are many buildings that have been designed and constructed under the Ministry of Works design code (1970), many being government buildings or public buildings constructed under government funding. Therefore the cities of New Zealand comprise of a large proportion of structures that have been designed with the limited structural engineering knowledge of pre 1972.
This report is the combined work of Nicholas Gulley, Ben Dare, James Bilkey and James Stewart and attempts to quantify a comparison between damage indices, actual damage and observed damage. The results herein aim to aid the designation of a damage index based on visual defects such as crack width and orientation observed of the beams of a particular structure subjected to an earthquake. A scaled structural member was designed according to the 1970 Ministry of Works design codes to resemble a typical member from a three story structure. Twelve identical members were then subjected to a range of standard tests and displacement sequences that would be experienced due to an earthquakes impact on a three story structure. Performance of the members was calculated using five different damage indices and compared against observed damage during testing.
Section 2.0 of this report describes a number of common damage indices used throughout the world and gives a comprehensive review of previous studies that have attempted to compare or modify these different damages indices. Section 3.0 gives the theory behind this project. A description of earthquake reinforced structures, failure mechanisms, measuring observed structural damage and data processing. Section 4.0 details the design and construction of the test unit as well as the details regarding the test set-up and instrumentation. Section 5.0 summarises the seven different standard loading history tests and the five earthquake loadings histories applied during the experimental stage of this project. Section 6.0 states the results of the twelve different tests, including the comparison of the members’ performance with the calculated damage indices and observed damage. Section 7.0 presents a comparison of results detailed in Section 6. Lastly, Section 8.0 details the conclusions of this report.
2.0 Literature Review (NG)
A literature review into different damage indices was conducted as part of this report. A damage index is usually defined as the damage value normalised with respect to the (arbitrarily defined) failure level so that a damage index value of unity corresponds to failure (Chung et al. 1989). Damage indices attempt to numerically quantify the damage that has been sustained by a beam during an earthquake. Large amounts of research has been undertaken to validate and compare the different damage indices, this research is also reviewed for each of the different damage indices.
Damage indices have been formed to take into account different components of structural degradation and with varying degrees of complexity. There are cumulative and non-cumulative indices, deformation and energy based indices as well as damage indices that combine different components. The different damage indices that are investigated are Ductility in Section 2.1, Roufaiel and Meyer in Section 2.2, Park and Ang in Section 2.3, Cosenza et al. in Section 2.4, Bracci et al. in Section 2.5, Banon and Veneziano in Section 2.6. Two further damage indices by Chung et al. and Kunnath et al. are discussed in Sections 2.7 and 2.8 respectively. Research into the comparisons are conducted for Roufaiel and Meyer, Park and Ang and Cosenza et al. in their respective Sections.
2.1 Ductility Ratio (µ)
This is the most simple damage index and because of its simplicity is quite widely used. It is defined as the ratio of maximum displacement achieved to the yield displacement (Liddell 2000). Mathematically that is:
![]() Equation 2.1
Equation 2.1
A value for µ1 corresponds to the beam yielding and µ2 is 2xµ1.
2.1.1 Cumulative Ductility
Is the sum of all of the cyclic non-linear ductility’s that member has been subjected to. Researches such as Banon and Veneziano (1982) and Bracci et al. (1989) have used it in the formation of their damage indices. It can however be used as a damage index by itself.
2.2 Roufaiel and Meyer (1987)
The damage index proposed by Roufaiel and Meyer (1987) is based upon a reduction in secant stiffness (Liddell 2000). They proposed a modified flexural damage ratio (MFDR) (Roufaiel and Meyer 1987) that took into account the direction of loading. The formula for the MFDR is shown below and the definition of each of the terms is shown in figure 2-1 and 2-2 and can also be expressed in terms of stiffness.
 Equation 2.2
 Equation 2.3
The MFDR is taken as the maximum of MFDR+ and MFDR-. A MFDR value of less than or equal to zero means that the member is undamaged, whilst a MFDR value of one signals the onset of failure.

Figure 2-1. Definition of Modified Flexural Damage Ratio (Roufaiel and Meyer 1987)

Figure 2-2. Moment curvature response from the New Zealand test showing the appropriate curvature values to use
The damage index was derived analytically and then a number of experiments were conducted to check the validity of the index (Roufaiel and Meyer 1987). This damage index accounts for the finite size of the plastic region and is appropriate to use when there is high shear or high axial forces. The results from the testing program have shown that the damage index created is a good indicator of the actual damage that has occurred to the beam (Roufaiel and Meyer 1987).
A number of tests have been undertaken using Roufaiel and Meyer’s damage index. Liddell (2000), Williams et al. (1997) and Ghobarah et al. (1999) have all conducted research using this damage index and are discussed in Section 2.2.1, Section 2.2.2 and Section 2.2.3 respectively. Chung et al. (1987) briefly mention Roufaiel and Meyer’s damage index in developing their own damage index.
2.2.1 Comparison by Liddell (2000)
Twelve tests were conducted on identical reinforced beams each having a different loading history applied to it, (Liddell 2000) four standard loading histories, five analytical acceleration histories and three fabricated tests. A number of different damage indices are investigated and the damage index proposed by Park and Ang (1985) is the most correct index (Liddell 2000). In the majority of the tests undertaken the value returned by the MFDR at the failure point was about 0.5 but was as low as 0.29 and as high as 1.25. A value of 1 or more only occurred in two tests, the Monotonic and Unidirectional Loading (Liddell 2000). Failure was expected in these two tests as the ultimate variables in the damage indices were normalised with respect to this test and both had the same ultimate ductility (Liddell 2000). In all of the other tests the index suggested that the beam had more strength available before failure would occur.
2.2.2 Comparison by Williams et al. (1997)
Six different tests were undertaken, each beam having a different moment to shear ratio or different stirrup spacing (Williams et al. 1997). All but one test recorded a MFDR value that was within 20% of a failure value. The MFDR values that were recorded when the test was stopped ranged from 0.9 to 3. The number of cycles and the shape of the curve for the different tests varied considerably. Williams et al. noted that most of the available damage indices consider flexural yielding only and do not consider the possibility of shear failure. The Roufaiel and Meyer index is described as being one of the best damage indices for the damage that has occurred to the beams (Williams et al. 1997). The overall conclusion from the paper by Williams et al. is that the “more sophisticated indices which attempt to take into account the damage caused by repeated cycling gives no more reliable an indication of damage than simple measures such as ductility and stiffness degradation”.
2.2.3 Comparison by Ghobarah et al. (1999)
Ghobarah et al. propose a new damage index and compare it with the damage indices proposed by Park and Ang (1985), Roufaiel and Meyer (1987) and the DiPasquale and Cakmak (1988) final softening damage model. The research is conducted on a three story frame building with four bays on one side and three on the other. They do this by comparing the damage indices at different peak ground acceleration and different levels of interstorey drift for different earthquakes. The research was not investigating whether failure occurred at the appropriate damage index, but whether there were any errors in the index and how they could improve their new index. Ghobarah et al. concluded that in some cases the averaging procedures that are employed by Park and Ang and Roufaiel and Meyer may give incorrect results.
2.3 Development of the Park and Ang Damage Index
The damage index proposed by Park and Ang (1985) is generally considered to be the most extensively used in technical literature. The development of the model was based on a linear combination of a simple ductility term, the maximum displacement, and the absorbed hysteretic energy (dissipated plastic energy). It was devised by investigating extensive test data taken from a variety of monotonic and cyclic loading sequences on reinforced concrete beams and columns, sourced in the U.S.A. and Japan (Park and Ang, 1985) the results of which were used to undertake a systematic regression analysis. All of the test sequences utilised single axis bending and were carried out on concrete members of rectangular section reinforced with deformed bars. The Park and Ang damage index is represented by the following models:
![]() Equation 2.4
Equation 2.4
or alternatively,
![]() Equation 2.5
Equation 2.5
The deformation terms, dmax & du can be determined directly from the stress-strain relationship of the structure when basic flexural behaviour is assumed, however when brittle failure modes are a possibility several additional factors need to be taken into consideration. Consequently an alternative solution was derived from an empirical relationship taken from monotonic test data taking into account the cumulative contributions of deformation resulting from flexure, shear, bond slippage, and elastic response. Following on from this the ultimate deformation can be represented by:
![]() Equation 2.6
Equation 2.6
Where ![]() Equation 2.7
Equation 2.7
In a similar fashion ß is based on the absorbed hysteretic energy results taken from selected test data, see Figures 2-3 & 2-4, which are integrated up to the point of failure, for members displaying brittle failure under cyclic loading. From this the following relationships were produced:
for Eq. 2.4: ![]() Equation 2.8
Equation 2.8
for Eq. 2.5: ![]() Equation 2.9
Equation 2.9
Of the above proposed equations (Eqs. 2.4 and 2.5) the first is by far the most widely adopted and is used in the bulk of comparative studies in which the model features, Eq. 2.5 is slightly more complicated as it takes into account the variation in the cyclic effect at different levels of deformation whereas Eq. 2.4 makes the assumption that the effect remains constant for all levels of deformation.


The levels of damage classification for the Park and Ang index suggested by Gunturi (1992) for various ranges of damage index were based on observations made on nine reinforced concrete structures which were affected by the 1971 San Fernando earthquake, the results of which are summarised in
Table 2-1. With reference to the aforementioned table, irreparable damage is described as crushing of the concrete and exposure of the reinforcement, repairable damage as severe cracking and localised spalling, and minor damage as light cracking.
|
Damage State |
Range of Index |
|
0.0 = D < 0.2 |
Minor Damage |
|
0.2 = D < 0.4 |
Repairable Damage |
|
0.4 = D < 1.0 |
Irreparable Damage |
|
D = 1.0 |
Collapse |
Table 2-1: Park and Ang Damage Classification Levels (Singhal and Kiremidjian 1995).
Although the Park and Ang model is widely accepted and applied throughout the world the two main assumptions upon which it is based have been disputed. Experimental evidence suggests that the assumption of the damage being a linear combination of the deformation and the absorbed hysteretic energy (Eqs. 2.4 and 2.5) and the manner in which the ß-factor considers several important structural parameters were not entirely valid (Chung et al. 1989). It should also be noted that under elastic response the results from Eqs. 2.4 and 2.5 should theoretically be equal to zero, but testing shows that they will return negligibly small nonzero D terms within the elastic range. This behaviour can be attributed to the fact that neither Eqs. 2.4 or 2.5 are normalised.
Since the first proposal and publication of the above damage index in 1985 there has been several alterations and adaptations to its original format, in response partially to this criticism and also due to non-critical improvements that have been made. Several of these variations are shown in the comparative studies detailed in Sections 2.3.1 to 2.3.4.
2.3.1 Comparison by Williams et al. (1997)
Williams et al. also used the damage index formulated by Park and Ang. They concluded that the results of all the damage indices had a tendency to display considerable scatter, which identified that none of the indices showed any real shear dependent behaviour. It was evident that the damage sustained during the testing was largely independent of the number of cycles and primarily was attributable to the level of deformation. From this they stated that deformation based indices were the most reliable. In addition to this the Park and Ang index was deemed to perform favourably during tests with large displacement cycles, dominant shear behaviour, and especially where ductile response was present.
2.3.2 Comparison by Cosenza et al. (1993)
Cosenza et al. addressed the issue of the need for the identification of a universal and precise definition of structural failure in reinforced concrete members under cyclic loading conditions. To produce such a general definition it was first necessary to establish a series of damage parameters with relevance to inelastic deformation and strength of structures subjected to repeated cyclic loading sequences.
This was attempted by comparing the results of several damage indices using both experimental loading histories and those experienced in previous real earthquakes. The main comparisons drawn were based on the damage model of Banon and Veneziano (1982). The basic ductility and dissipated hysteresis energy models were used as a basis to compare the more advanced indices mentioned above, using ten simple cyclic loading histories and four actual seismic events.
Throughout the study an attempt was made to calibrate the three main models in an effort to normalise them to produce a more representative comparison. This was done by finding mean values of the major defining parameters for each of the models, (a) for Banon and Veneziano, (b) for Park and Ang, and (b) for the Plastic Fatigue model.
Following these experimental and observed results Cosenza et al. (1993) were able to draw several relevant conclusions. It was seen that the Banon and Veneziano (1982) and Park and Ang damage indices provide conservative results compared with the plastic fatigue model when subjected to loading sequences consisting of a high number of cycles and minimal displacement. Also noted was the fact that the difference in results between Banon and Veneziano and Park and Ang were irrelevant when considering the simple cyclic histories analysed, while the plastic fatigue results were significantly different. However with the load sequences closely resembling that of the actual quakes the results for all were very similar.
2.3.3 Comparison by Kunnath et al. (1997)
Kunnath et al.(1997) conducted a comprehensive study in an attempt to determine the response of circular reinforced concrete bridge piers under repeated cyclic loading. The study was conducted in an effort to investigate the likely behaviour of such structures when subjected to actual earthquake loadings, similar to those experienced in the 1971 San Fernando quake, and in particular the cumulative damage that they could endure. In accordance to current AASHTO (American Association of State Highway and Transportation Officials) specifications under flexural response twelve identical pier structures were designed and built to quarter scale at the National Institute of Standards and Technology in Gaithersburg, Maryland and prepared for testing.
Four separate damage indices were selected for evaluation during the research procedure in an effort to have a broad representation and also to make known the strengths and weaknesses of each index when used in conjunction with circular reinforced concrete sections.
They proposed that the success of a damage model should not entirely be dependent on its ability to accurately predict damage within a structural component prior to loading, although this is an essential function of any model. Models are also required to be able to be evaluated in such a manner that they can be successfully implemented to assess the structural integrity of a member following a seismic event. The testing of the twelve specimens was separated into two sections; the first six were subjected to a series of cyclic loading histories of varying amplitude and frequency while maintaining a set pattern. In contrast to this the final six specimens were tested using a series of random cyclic reversals, similar to what one would expect to experience during an actual seismic event.

Figure 2-5. Comparative damage evaluation for specimen under lateral drift cyclic loading. (Kunnath et al. 1997)

Figure 2-6. Comparative damage evaluation for specimen under simulated major earthquake followed by two smaller after shocks. (Kunnath et al. 1997)
Under the more regular loading sequences of the first six specimens and especially during those tests with a large number of cycles and a low to medium level of lateral drift, up to 5%, the Kratzig et al. (1989) and softening index models demonstrated damage accumulation which was inconsistent with observed results. The models based on non-fatigue concepts, Kratzig et al. (1989), softening index, and Park and Ang, failed to accurately predict the damage state at the conclusion of the testing. When the specimens experienced a higher lateral drift and hence a lower number of cycles before failure the Park and Ang index was seen to perform better when the actual displacement exceeded the yield displacement. All of the non-fatigue models over-predicted the initial damage resulting from the first cycles and demonstrated their inability to cope with low-cycle fatigue damage, this is evident in Figure 2-5. The non-fatigue models accurately indicated the severe damage from the initial displacement while the fatigue model shows no real evidence of this as shown in Figure 2-6., in addition the Park and Ang model also indicated the damage resulting from the two minor tremors. In conclusion Kunnath et al. (1996) summarised that the Park and Ang index consistently provided accurate damage measures at varying limit states and was the most applicable of the non-fatigue models.
2.4 Banon and Veneziano Index
The Banon and Veneziano Index (1982) is based upon a combination of ductility and dissipated energy, and it also incorporates probabilistic concepts. The damage index is made up of the Equations, 2.10, 2.11 and 2.12.
![]() Equation 2.10
Equation 2.10
Where: ![]() Equation 2.11
Equation 2.11
 Equation 2.12
A normalized value is often used and is obtained by dividing the given expression by the value it assumes at failure in a monotonic test. As with the index proposed by Roufaiel and Meyer, the structure is considered undamaged when the damage index is less than or equal to zero and failure has occurred when the damage index is one.
2.5 Cosenza et al. (1993) Index
This is defined where the displacement ductility value is a measure of the damage parameter and the ultimate value is defined as the ductility obtained under monotonic testing, giving:
 Equation 2.13
2.6 Bracci et al. Index
The Bracci et al. (1989) index is based on the relation of demand and capacity where the total capacity of the component to sustain damage, is defined as the area between the monotonic load-deformation curve and the fatigue failure envelope. The damage demand consists of strength loss and deformation related damage. Strength loss is defined as the loss of a components ability to sustain damage due to strength degradation and dissipated hysteric energy and deformation damage corresponds to irrecoverable permanent deformations. The damage potential, ![]() , the strength damage,
, the strength damage, ![]() , and the deformation damage,
, and the deformation damage, ![]() , combine to form the damage index defined as:
, combine to form the damage index defined as:
![]() Equation 2.14
Equation 2.14
Using the origin-centred bilinear relationship and assuming that initial and post-yielding stiffness is the same in both directions the following damage index equation was derived by Bracci et al.
![]() Equation 2.15
Equation 2.15
Bracci et al. suggested four classification states based on experimental behaviour and Table 2-2 lists the four damage states.
|
Damage State |
Limiting Damage Index |
|
Serviceable State |
D = 0.33 |
|
Repairable State |
0.33 < D = 0.66 |
|
Irreparable State |
0.66 < D = 1.0 |
|
Collapse State |
D > 1.0 |
Table 2-2 Bracci et al. Damage Classification Levels
2.6.1 Comparison by Liddell (2000)
Liddell also used the Bracci et al. damage index in his research. Liddell concluded that Bracci et al. index gave the best correlation between the calculated index and observed damage along with the Park and Ang (1985) index. Liddell also concluded that in general the Bracci et al index over-predicted the amount of damage that occurred during testing due to the hysteresis model failing to accurately account for pinching in the hysteresis loops and for strength degradation near the conclusion of the tests.
2.6.2 Comparison by Williams and Sexsmith (1995)
Williams and Sexsmith (1995) concluded from their state-of-the-art review that the Bracci et al. index gave a rather more even spread of numerical values across the range of damage states than a lot of the other indices reviewed. The Bracci et al. model appeared to have a stronger theoretical basis and shows a good correlation with observed damage, but could be improved by the implementation of a more sophisticated moment-curvature relationship, rather than the simple bilinear curve currently used.
2.7 Chung, Meyer and Shinozuka Damage Index
In 1987, Chung et al. (1987) proposed a new damage model as a rational measure of damage sustained by reinforced concrete members undergoing strong cyclic loading. The proposed damage index ![]() combines a modified Minor’s hypothesis with damage modifiers that reflect the effect of the loading history, and considers the fact that reinforced concrete members typically respond differently to positive and negative moments:
combines a modified Minor’s hypothesis with damage modifiers that reflect the effect of the loading history, and considers the fact that reinforced concrete members typically respond differently to positive and negative moments:
![]()
 Equation 2.16
When counting load cycles ni, only those cycles that enter the shaded area shown in Figure 2-7 are considered, i.e., load cycles No. 1 and 2 are not counted when computing the damage index, ![]() .
.

Figure 2-7 Domain for damaging load of positive sense.
The loading history effect is captured by including the damage accelerator aij, which, for positive loading, is defined as:
 Equation 2.17
where:
 Equation 2.18
is the stiffness during the j-th cycle up to load level i,
![]() Equation 2.19
Equation 2.19
is the average stiffness during![]() cycles up to load level i, and
cycles up to load level i, and
![]() Equation 2.20
Equation 2.20
is the moment reached after j cycles up to load level i
For negative loading, the damage accelerator is defined similarly,
 Equation 2.21
 Equation 2.22
![]() Equation 2.23
Equation 2.23
![]() Equation 2.24
Equation 2.24
Chung et al. have demonstrated the accuracy with which their proposed mathematical model can simulate hysteretic response of reinforced concrete members by numerically reproducing many experimental results. Experimental and analytic load-deformation curves of beams tested by Hwang (1982) and Ma, Bertero, and Popov (1976) are shown in Figures 2-8 and 2-9. Agreement between numerical and experimental results was in general excellent.
Further comparisons were made by Chung et al. (1990) of their damage index using the experimental and numerical values of cumulative dissipated energies of specimens which have been tested by Hwang (1982), Ma, Bertero and Popov (1976) and Popov, Bertero and Krawinkler (1972). Disagreements between experimental and numerical results are most noticeable in the early load cycles of some of the specimens, but the total energies dissipated by the time the tests were terminated show very good agreement. (Chung et al. 1990).
Hatamoto et al. (1990) defined four damage states based on the Chung et al. (1987) damage index. The four damage states considered are: Minor, Repairable, Irreparable and Unsafe. The ranges of the damage index for these four states are presented in Table 2-3.

Figure 2-8 Experimental and analytic load-deformation curves for Beam S2-3 tested by Hwang (1982) (1 in. = 2.54cm; I kip = 4.448 kN)

Figure 2-9 Experimental and analytic load-deformation curves for Beam R5 tested by Ma, Bertero, and Popov (1976) (1 in. = 2.54cm; I kip = 4.448 kN)
|
Damage State |
Range of the damage index |
|
Minor |
0.0 – 0.2 |
|
Repairable |
0.2 – 0.5 |
|
Irrepairable |
0.5 – 1.0 |
|
Structure Unsafe |
= 1.0 |
Table 2-3. Chung Mayer and Shinozuka (1987) damage index for different damage states as defined by Hatamoto et al. (1990)
2.8 Damage index by Kunnath et al. (1992)
Kunnath et al. proposed a damage index that could be used in computational analysis. This superseded the program DRAIN-2D (Kanaan and Powell, 1973) and IDARC (Inelastic Damage Analysis of Reinforced Concrete) (Park and Ang 1985). Their damage index was based on moment, rotation and dissipated hysteretic energy and is shown in Equation 2.25.
![]() Equation 2.25
Equation 2.25
The index was formed to be used in IDARC however it can also be used directly to determine damage at each member cross section. Kunnath et al (1992) stated, “the intent of the ![]() parameter was to provide a correlation between strength loss and damage, the present version uses the same parameter for both damage computations and hysteretic modelling.”
parameter was to provide a correlation between strength loss and damage, the present version uses the same parameter for both damage computations and hysteretic modelling.”
The strength degrading parameter (![]() ) can have varying values as shown in Table 2-4.
) can have varying values as shown in Table 2-4.
|
Description for |
|
|
Well Detailed Section- No Deterioration |
0.05 |
|
Nominal Deterioration |
0.1 |
|
Poorly Detailed Section- Severe Deterioration |
0.4 |
Table 2-4: Typical Range of Values for ß
However ![]() can be calculated using the following formula:
can be calculated using the following formula:
![]() Equation 2.26
Equation 2.26
The effects that ![]() has on the hysteretic curves that it models can be seen in Figure 2-10.
has on the hysteretic curves that it models can be seen in Figure 2-10.

Figure 2-10. Effect of ß on the hysteretic curves (Kunnath et al, 1992)
Stone and Taylor (1993) calibrated the damage index proposed by Kunnath et al (1992) to the damage conditions. They determined after close examination of the data that the tenth percentile of each of the three limiting conditions would provide the threshold for the damage index. From this Stone and Taylor defined the different values that the damage index could return, these are shown in Table 2-5.
|
Damage Condition |
Limiting Damage Index |
|
No Damage |
D < 0.11 |
|
Repairable |
0.11 |
|
Demolish |
0.4 |
|
Collapse |
D |
Table 2-5. Damage Condition and corresponding Limiting Damage Indices (Stone and Taylor, 1993)
3.0 Theory (JB)
This section provides the background theory on concepts that formed the basis of this report. Section 3.1 details the design theory of earthquake reinforced structures in New Zealand. Section 3.2 summarises the principal failure mechanisms of reinforced concrete structures under earthquake loadings. Section 3.3 covers the link between structural damage and observed damage. Section 3.4 summarises the formulae that were utilised for processing data recorded during testing.
3.1 Earthquake Reinforced Concrete Structures
New Zealand lies on the edge of the Pacific Plate and therefore has very active fault lines running through most of the country. Since the 1840’s there have been 17 shallow (within 40km of the surface) earthquakes with a magnitude greater than 7.0 on the Richter scale, including five greater than 7.5 (GeoNet, 2005). Design for earthquake resistance of reinforced concrete structures throughout New Zealand is essential because of the risk posed by large earthquakes. The design of structures for resistance to earthquakes in New Zealand has been an important part of many New Zealand Standard Design Codes including the current NZS 4203:1992 Standard Loadings Code.
3.1.1 Current Performance Criteria
The 1992 New Zealand standard for general structural design and design loadings for buildings (NZS 4203:1992) specified two performance criteria:
1) Serviceability Limit State:
To protect the building during a one in 10 year earthquake from structural damage and to limit damage in non structural components (NZS 4203:1992).
2) Ultimate Limit State:
To protect life and to ensure the building will not collapse in a one in 450 year earthquake (NZS 4203:1992).
3.1.2 Current Design Methodology for Ultimate Limits
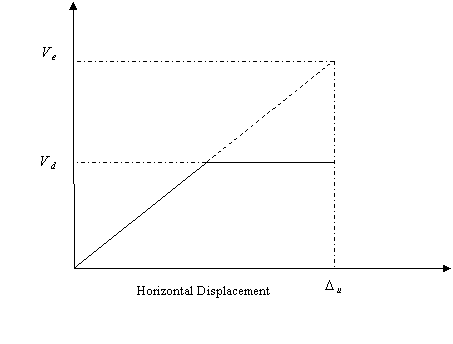
To achieve the ultimate limit NZS 4203:1992 specifies the ultimate elastic horizontal inertia force ![]() for different areas of New Zealand. This ultimate elastic horizontal inertia force can be up to 1.0g and therefore the costs involved in constructing a building to withstand ultimate limit make elastic design uneconomic in all but high importance public buildings. For an economic solution to elastic design, the design methodology of ductile building response is used. The ductility of a building is the ability to sustain its force carrying capacity while being displaced in the post-elastic range (Park, 2001). The building must carry a design horizontal inertia force
for different areas of New Zealand. This ultimate elastic horizontal inertia force can be up to 1.0g and therefore the costs involved in constructing a building to withstand ultimate limit make elastic design uneconomic in all but high importance public buildings. For an economic solution to elastic design, the design methodology of ductile building response is used. The ductility of a building is the ability to sustain its force carrying capacity while being displaced in the post-elastic range (Park, 2001). The building must carry a design horizontal inertia force ![]() , specified in NZS 4203:1992, and ductility must be maintained in the post-elastic range up to the ultimate horizontal displacement
, specified in NZS 4203:1992, and ductility must be maintained in the post-elastic range up to the ultimate horizontal displacement ![]() , see Figure 3-1.
, see Figure 3-1.
  |
![]()
![]()
Figure 3-1 Ductility Two Response for a building period of greater than 0.7 seconds
Ductility can be achieved by designing plastic hinges into buildings (Figure 3-2). This is a cost effective way of allowing the building to behave in a ductile manner up to ![]() whilst protecting life and ensuring the building will not collapse in a one in 450 year earthquake.
whilst protecting life and ensuring the building will not collapse in a one in 450 year earthquake.

Figure 3-2 Plastic Hinges in a three bay three story building
3.1.3 Pre 1972 Design
NZS1900 (1965) was the prevalent design code used in New Zealand from 1965 to 1972. It had limitations in that the design earthquake forces ![]() were generally much smaller than those which are now required under NZS4203:1992. Therefore buildings designed to these reduced forces will go further into the post-elastic range during a significant earthquake. For the NZS4203:1992 ultimate limit states to be achieved the building would have to have a larger amount of ductility. Although NZS1900 incorporated the concept of designing for ductility, there was minimal understanding of ductile behaviour during earthquakes. Through our lab testing and other testing, damage in critical sections of buildings has been predicted during earthquakes. Typical predicted failures include beam and beam column joint failure. The beam and beam column joints fail through a number of mechanisms including; longitudinal bars sliding through the joints (Speed, 2005 and Russell, 2005) and not enough shear reinforcement in both the column and the beam (Figure 3-3 and Figure 3-4). During this period the Ministry of Works, which was designing all government owned buildings and the majority of other multi-storey buildings in New Zealand, was using a Code of Practice (P.W. 81/10/1: May 1970) which was a supplement to the NZS1900 design codes. The purpose of this Code of Practise was to minimise non structural damage of government buildings. In this supplement extra emphasis was given to shear reinforcement in the joint zone, however in comparison to modern codes the shear reinforcement was still lacking. In our study we have seen that low amount of shear reinforcement leads to the shear failure of the beam (Figure 3-4).
were generally much smaller than those which are now required under NZS4203:1992. Therefore buildings designed to these reduced forces will go further into the post-elastic range during a significant earthquake. For the NZS4203:1992 ultimate limit states to be achieved the building would have to have a larger amount of ductility. Although NZS1900 incorporated the concept of designing for ductility, there was minimal understanding of ductile behaviour during earthquakes. Through our lab testing and other testing, damage in critical sections of buildings has been predicted during earthquakes. Typical predicted failures include beam and beam column joint failure. The beam and beam column joints fail through a number of mechanisms including; longitudinal bars sliding through the joints (Speed, 2005 and Russell, 2005) and not enough shear reinforcement in both the column and the beam (Figure 3-3 and Figure 3-4). During this period the Ministry of Works, which was designing all government owned buildings and the majority of other multi-storey buildings in New Zealand, was using a Code of Practice (P.W. 81/10/1: May 1970) which was a supplement to the NZS1900 design codes. The purpose of this Code of Practise was to minimise non structural damage of government buildings. In this supplement extra emphasis was given to shear reinforcement in the joint zone, however in comparison to modern codes the shear reinforcement was still lacking. In our study we have seen that low amount of shear reinforcement leads to the shear failure of the beam (Figure 3-4).
|
Figure 3-3 Shear failure of the beam column joint after the California Earthquake

Figure 3-4 Shear Failure of a beam in laboratory testing
3.2 Failure Mechanisms
There are three main failure mechanisms for reinforced concrete members. They are shear, flexure and low cycle fatigue. As discussed in Sections 3.2.1-3.2.3 below.
3.2.1 Shear
Gosain et al (1977) noted that when reinforced concrete members were subjected to repeated and reversed loads that produced large deflections, the shear failure of the member may limit the ductility of the member.
There are two main modes of shear failure. The first is the confining shear reinforcement failing. Typical of confining shear reinforcement failure are large diagonal shear cracks which can be seen in Figure 3.4. The second is the diagonal concrete compression strut failing. This results from too much confining shear reinforcement and leads to an undesirable brittle failure.
3.2.2 Flexure
Reinforced concrete can fail in flexure in either compression or tension. Compression failure occurs when the ratio of steel to concrete is too high and the concrete develops yield strain before the steel does. Only small cracks and deformations are observed before a brittle failure occurs, and consequently this is undesirable in concrete structures. Tensile failure occurs when the yield strain of the steel is reached before that of the concrete. Large cracks and deformations are observed as the member fails in a ductile manner.
3.2.3 Low Cycle Fatigue
Kunnath et al (1997) observed the low cycle fatigue of longitudinal bars in columns when large displacement amplitudes were applied to test specimens. They found that testing that was predominantly inelastic would be more likely to have the longitudinal bars fail.
3.3 Measuring Observed Structural Damage
There is little information available on how to measure the structural damage of reinforced concrete beams designed to pre 1972 design codes after a seismic event. The state of damage of a reinforced concrete beam could be predicted by using damage indices prior to or after a seismic event (Section 2). To measure the observed structural damage of a reinforced concrete beam it is necessary to be able to compare known observed damage with a state of calculated damage. Many damage conditions have been proposed including Park and Ang (1985) and Stone and Taylor (1993). They have attempted to correlate damage indices with observed damage. However these damage conditions are not rigorously defined and therefore it is not clear by observation what state of damage a reinforced concrete beam is in. For accurate prediction of damage to reinforced concrete beams designed to pre 1972 codes it is necessary to correlate observed damage from laboratory testing with a state of damage. This state of damage should be obtained from a damage index to also allow prediction of damage during a seismic event.
3.4 Processing Data
Changes in length of our beam, were taken from the network of the displacement transducers, as a gauge group, as detailed in Section 4.4, during testing. By processing these changes we were able to calculate the various components of displacement, curvature, beam depth increase and elongation as the test proceeded.
3.4.1 Components of Displacement
When force is applied by an actuator to a reinforced concrete beam, we can measure the displacement of the beam at the point where the actuator is. This displacement can also be approximated by combining the individual components of this displacement. In our testing, Shear, Flexure and Rocking all contributed to the displacement which we measured and these can be calculated as below.
3.4.1.1 Shear Displacement
Shear displacement can be found using the change in diagonal lengths of a gauge group, as shown in Figure 4-14, and the distance between the centre of this gauge group and the centre of the actuator (![]() ). Figure 3-6 below shows the shear displacement component.
). Figure 3-6 below shows the shear displacement component.
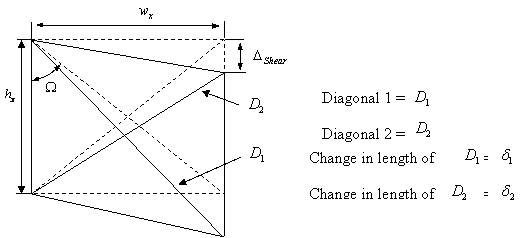
Figure 3-6 Shear Displacement
Solving for the width of a gauge group (![]() ):
):
![]() Equation 3.1
Equation 3.1
![]() Equation 3.2
Equation 3.2
Equating ![]() and solving for the shear displacement of the gauge group (
and solving for the shear displacement of the gauge group (![]() ):
):
![]() Equation 3.3
Equation 3.3
The ![]() factor is nominally small for beams that do not have a large amount of shear deformation such as beams designed to modern codes, and therefore this has been excluded in other testing (Lau 2001). However because our beams have shown large amounts of shear deflection these numbers are more significant and therefore they have been included in our calculations.
factor is nominally small for beams that do not have a large amount of shear deformation such as beams designed to modern codes, and therefore this has been excluded in other testing (Lau 2001). However because our beams have shown large amounts of shear deflection these numbers are more significant and therefore they have been included in our calculations.
The total shear deflection can be found by adding together all of the gauge group displacements:
![]() Equation 3.4
Equation 3.4
3.4.1.2 Flexural Displacement
Flexural displacement at the actuator can be calculated by finding the angle of rotation within a gauge group (![]() ) and multiplying this angle by the distance between the centre of this gauge group and the centre of the actuator (
) and multiplying this angle by the distance between the centre of this gauge group and the centre of the actuator (![]() ). Figure 3-7 below shows the flexural displacement component.
). Figure 3-7 below shows the flexural displacement component.
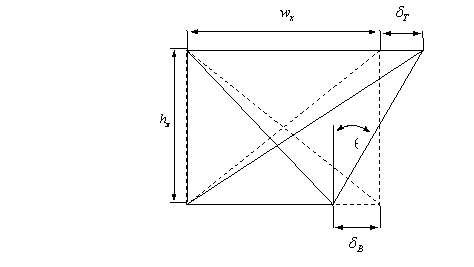
Figure 3-7 Flexural displacement
Rotation within a gauge group (![]() ):
):
![]() Equation 3.5
Equation 3.5
Flexural displacement at the actuator:
![]() Equation 3.6
Equation 3.6
The total flexural displacement can be found by adding together all of the gauge group displacements:
![]() Equation 3.7
Equation 3.7
3.4.1.3 Rocking Displacement
Elongation of the tensioning down rods (see Figure 4-11) causes the test unit to rock. Movement at the column faces can be measured (![]() and
and ![]() ) and this by multiplying by the distance to the actuator
) and this by multiplying by the distance to the actuator ![]() , displacements due to rocking can be measured. Figure 3-8 below shows the displacement component as a result of rocking.
, displacements due to rocking can be measured. Figure 3-8 below shows the displacement component as a result of rocking.

Figure 3-8. Rocking Displacement
Rocking displacement at the actuator:
![]() Equation 3.8
Equation 3.8
3.4.1.4 Calculated Displacement
This can be found be adding Shear, Flexure and Rocking Displacement together:
![]() Equation 3.9
Equation 3.9
3.4.2 Curvature
Curvature is the rate of rotation of a section of the beam. It is used in the determination of some damage indices. It can be calculated for each gauge group and is found by dividing rotation (![]() ) by the width of the gauge group (
) by the width of the gauge group (![]() ).
).
Rotation within group (![]() ):
):
 Equation 3.10
Curvature within the group:
![]() Equation 3.11
Equation 3.11
3.4.3 Elongation
The elongation is calculated to show the change in length of the beam. When the beam increases in length this can cause displacement of the adjacent columns and additional buckling of the beam itself. The elongation of each panel itself is calculated using the displacement readings taken from each of the gauge groups by taking the sum of the changes in length of the top and bottom chords, dT and dB respectively. This represented diagrammatically below in Figure 3-9.
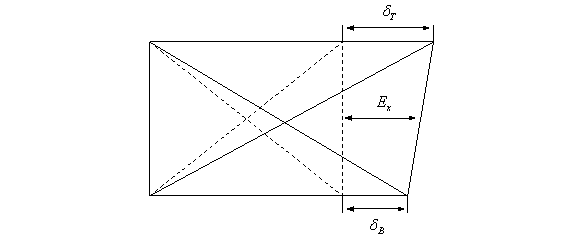
Figure 3-9 Elongation of a panel
Hence the elongation within a panel is given by:
![]() Equation 3.12
Equation 3.12
Finally the Total Elongation of the beam is comprised of the summation of the elongations of all the separate panels:
![]() Equation 3.13
Equation 3.13
3.4.4 Increase in Depth
The increase in depth of the beam can be measured directly by the increase in length of the displacement transducers. It is useful for showing the correlation between shear deformation and actuator displacement. For the gauge group, increase in depth is the average of ![]() and
and![]() . Figure 3-10 below shows the increase in depth of a panel.
. Figure 3-10 below shows the increase in depth of a panel.
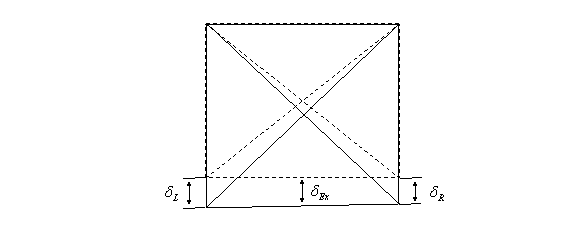
Figure 3-10 Increase in depth of a panel
Thus the increase in depth of a gauge group or panel is given by:
![]() Equation 3.14
Equation 3.14
4.0 Test Assembly Design, Construction, and Set-Up (BD)
The testing set-up detailed in this section features a test unit, consisting of two reinforced concrete beams connected by a central column section, mounted onto a concrete testing pedestal. The loading histories applied to the test unit are aimed at simulating the response of the beam section of a reinforced concrete frame structure when subjected to seismic load reversals. Such a structure was selected because similar frames were prevalent in Government Buildings constructed in New Zealand throughout the 1970s.
This formed the basis for the prototype design building, detailed in Section 4.1, that the design of the test units was based on. The actual design of the test specimens themselves however was undertaken using the guidelines laid down in NZS1900 (1965) and the 1970 Ministry of Works Design Codes, and is covered in Section 4.2. Section 4.3 depicts the details of and procedures followed during the construction sequence of the test units. Section 4.4 illustrates pre-testing arrangement of the units and Section 4.5 presents the layout of the instrumentation used during testing. Finally, Section 4.6 describes the manner in which the data gathered using the instrumentation detailed in Section 4.5 was used to isolate the separate displacement components and moment-curvature relationships presented within the data.
4.1 Prototype Design
As previously stated in the introductory Section 4.0 the prototype design building utilised, was based on a government style office building designed and constructed using the prevalent standards from the early 1970s. The project supervisor Dr. Barry Davidson was able to design a three storey, three bay structure that was suitable for the above requirements, which is shown in Figure 4-1.
Using nonlinear time history analyses of two dimensional frame structures five earthquake loading histories were derived, the details of which are covered latter in Section 5.0. When conducting the analysis of the structure the columns were assumed to be pinned at the base and to remain elastic throughout while the beams were identical to those used in the test units, the design of which is covered in Section 4.2. Several key properties used in the above calculations are detailed below;
E = 3E7 kN/m2
Ibeam = 0.000369 m4
Icolumn = 0.0005 m4
Acolumn = 0.09 m2
In order to achieve satisfactory displacement demands on the beams for the separate earthquake loading histories the mass of each floor level was adjusted accordingly.
4.2 Test Unit Design
The design standards implemented during the test unit design are detailed in Section 4.2.1 while the specific details of the beam and column sections are illustrated in Section 4.2.2 and Section 4.2.3 respectively.
4.2.1 Design/Loadings Codes
As noted in the above sections all attempts were made to ensure that the beams being tested were in fact accurate replications of government buildings constructed during the 1970’s. In order to achieve this, the design of the test units specified hereafter is based on the 1970 Ministry of Works Code of Practice for the design of Public Buildings used in conjunction with NZS1900:1965.
4.2.2 Beam Design
It should first be noted that the overall dimensions of the test unit were largely governed by the existing boxing that was available for use in the University Laboratory. This constraint required the adaptation of the overall beam sectional dimensions of the beam to be 200x450. The adopted beam length of 1.55m from the column face was less restricted, as stop ends could be freely placed in the boxing to create a beam of desired length. In addition to the limitations enforced by the boxing the final specified test unit design varied from that of a similar 1970’s structure by the fact that the common concrete and reinforcement strengths of that period being 25MPa and 250MPa respectively, are no longer readily available. Hence a concrete strength of 30MPa and steel reinforcement strength 300MPa were adopted as alternatives.
Working within the above mentioned parameters the resultant reinforcement details as shown in Figure 4-2 and Figure 4-3 were adopted.
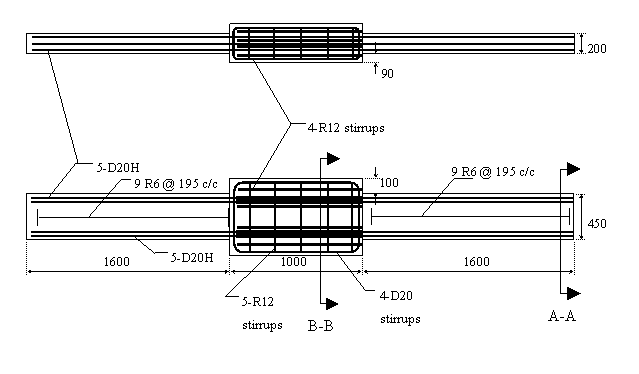
Figure 4-2 Reinforcement Layout in Test Unit.
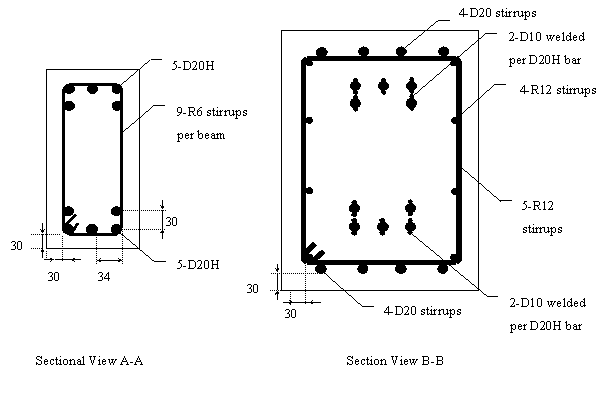
Figure 4-3 Cross Sectional View of Reinforcement Layout.
4.2.2.1 Longitudinal Reinforcement
Using the details provided above in Figure 4.2 and Figure 4.3 the strength provided by the 5-D20H longitudinal reinforcement bars was calculated as per the following:
Tension force in reinforcement;
Equation 4.1
= 471.3 kN
Following on from this the depth of the equivalent rectangular stress was found to be;
Equation 4.2
= 92.4 mm
Therefore;
Equation 4.3
= 345.8 mm
Hence the nominal moment capacity was determined to be;
Equation 4.4
= 163 kNm
From this the nominal flexural strength of the beam was found to be;
Equation 4.5
= 105 kN
4.2.2.3 Transverse Reinforcement
After the completion of the longitudinal reinforcement capacity design the transverse reinforcement capacity of the R6 stirrups at 195 centres was determined.
The shear stress in the concrete;
Equation 4.6
= 1.48 MPa
The requirements specified in NZS1900 governed the chosen ratio of tension reinforcement, which in turn largely dictated the size and number of the longitudinal bars. Hence pw was taken as;
Equation 4.7
= 0.02
Shear strength provide by the concrete;
Equation 4.8
= 116.0 kN
Shear strength provide by the transverse reinforcement;
Equation 4.9
= 33.9 kN
Hence the nominal shear strength was determined to be;
Equation 4.10
= 149.9 kN
It was desired with our initial design as per NZS1900 to have a nominal moment to shear ratio, Mn/Vn, of approximately 1.5. This however was unattainable due to the limitations imposed by the boxing dimensions, and hence an actual ratio of 1.09 was adopted.
4.2.3 Column Design
This was not specifically designed for as the test unit was designed for failure to occur in the beam section, away from the column face. Hence an exact design was not undertaken, and the strength of the column was section was increased to such a level as avoid the possibility of failure occurring in such a manner. The magnitude of this strength increase was taken from a previous test design, outlined in Liddell (2000), which used a similar beam cross-section, and under similar loading histories it was demonstrated that no failure was present in the column section. Hence a similar reinforcement pattern, which consisted of the welding of additional longitudinal reinforcement to the existing bars through the column section as shown in Figure 4-4 was adopted in the design. The full reinforcement details for the beam and column sections can be seen in Figure 4-2 and Figure 4-3.
4.3 Construction Details
In order to conduct an accurate and fair comparison of the chosen damage indices under the influence of the different applied loading histories it was necessary to construct six nominally identical test units. Section 4.3.1 covers the steps taken to minimise the variability of the materials used during construction and Section 4.3.2 details the construction sequence for each of the test units.
4.3.1 Materials:
As previously mentioned each test unit was comprised of two identical reinforced concrete beams extending from either side a of central column section. A summary of the material properties of the reinforcing steel and concrete used in construction of the test units are given in Sections 4.3.1.1 and 4.3.1.2 respectively.
4.3.1.1 Steel Reinforcement
By ensuring that all of the reinforcement steel came from the same production batch the likely hood of any difference in the material properties of individual bars was greatly reduced. The stress-strain curves of four randomly selected sample specimens of the D20H longitudinal reinforcing steel under increasing tensile loading until necking in a 1000 kN Avery test machine can be seen in Figure 4-5.
From these curves it can be seen that although there are some small variations in the ultimate strain value and strain hardening behaviour the yield strength and Young’s modulus remain approximately constant for all of the test samples. Average values of the yield strength and Young’s modulus were calculated from the test data and returned values of 316.75 MPa and 196.35 GPa respectively. The value of yield strength was as expected, being slightly in excess of the specified strength of 300 MPa, while the Young’s modulus was also very close to the conventional grade 300 steel modulus value of 200 GPa.
The longitudinal reinforcing steel that was used in the design and construction of the test units was all Grade 300 deformed bar and was not of the same specifications as the actual reinforcement used in New Zealand Government buildings constructed throughout the 1970s, however this was what was available from the supplier and hence what was used. In order to exactly replicate the beams from such structures it would have be necessary use Grade 250 round bars which are no longer commercially produced in New Zealand.
4.3.1.2 Concrete
The design mix had a specified slump of 120mm and an average compressive strength of 30MPa after 28 days of curing under normal conditions. As mentioned above in Section 4.4.1.1 the materials that were desired for the test units and those that were used were not always of the same specifications. These mix design parameters used were not perfect for the design as ideally 25MPa strength concrete would have been used, as was commonly used in New Zealand throughout the 1970s, but as this was not readily available from the supplier 30MPa strength was used as an alternative.
In order to accurately compare the different loading histories it was important to minimise any variations in the concrete strength between the separate test units. It was identified that possible reasons for inconsistencies in the concrete strength could be attributed to the concrete being sourced from dissimilar batch mixes and being of different curing ages. The concrete samples were tested at the same time as the testing of the corresponding test units. This was done to ensure that the actual concrete strength at the time of testing was known. Figure 4-6 (a) and Figure 4-6 (b) show the concrete strength development history for the two samples, and it can be seen that throughout the duration of the testing process the concrete strength remained relatively constant. From the afore mentioned figures it can be seen that the testing of the beams was undertaken over a period of approximately 60 days, from 30-90 days after pouring, it can also be seen that over this period there was only a small increase in the concrete strength. Due to the insignificance of this change in strength the influence it had on our test results was deemed to be negligible.
Due to constraints imposed by the quantity of available timber boxing it was not possible to pour all of the test unit from the same production batch and therefore two separate pours had to be made each consisting of three test units each. Although the mix design specifications were very similar for both of the pours it can be seen in Figure 4-6 (a) and Figure 4-6 (b) that the development of the concrete strength over time was not the same for both batches.
It was discovered that the exact specifications for each of the concrete mix designs used for construction were not in fact identical as first assumed, the details of the two batches are summarised below in Table 4-1 and Table 4-2. This discrepancy was however deemed to be of negligible significance as the net effect of the difference in compressive strengths from the two separate batches was that the neutral axis of the beam moved by less than 2mm. Thus having a minimal influence on overall strength of the beam.
Figure 4-6 (a) Concrete Strength History Batch Two.
|
Mix Type |
301 |
|
Mix Strength |
30 MPa 13mm |
|
Cement Milburn GP |
310 kg/m3 |
|
Free Water |
173 Litres/m3 |
|
13 mm (SSD) |
1000 kg/m3 |
|
7 mm (SSD) |
610 kg/m3 |
|
Sand (SSD) |
410 kg/m3 |
|
Water Reducer |
400 mL/100 kg of cement |
Table 4-1 Concrete Mix Design for batch one.
|
Mix Type |
301GP |
|
Mix Strength |
30 MPa 13mm |
|
Cement Milburn GP |
340 kg/m3 |
|
Free Water |
210 Litres/m3 |
|
13 mm (SSD) |
580 kg/m3 |
|
7 mm (SSD) |
800 kg/m3 |
|
Sand (SSD) |
540 kg/m3 |
|
Water Reducer |
400 mL/100 kg of cement |
Table 4-2 Concrete Mix Design for batch two.
The strength characteristics of the initial batch shown in Figure 4-6 (a) demonstrates an actual average strength of 32.6MPa which is higher than that of the second batch, Figure 4-6 (b), which had an actual average strength of 27.7MPa, which is below the specified strength of 30MPa. This lack of compressive strength was deemed to be attributable to there being additional free water being added to the mix prior to pouring and not the difference in the mix designs. Slump tests performed in the University Laboratory during the pouring of the test units, as illustrated in Figure 4-7, showed that the actual slump of the first batch was 150mm and the second batch was 190mm. Both in excess of the specified slump of 120mm.
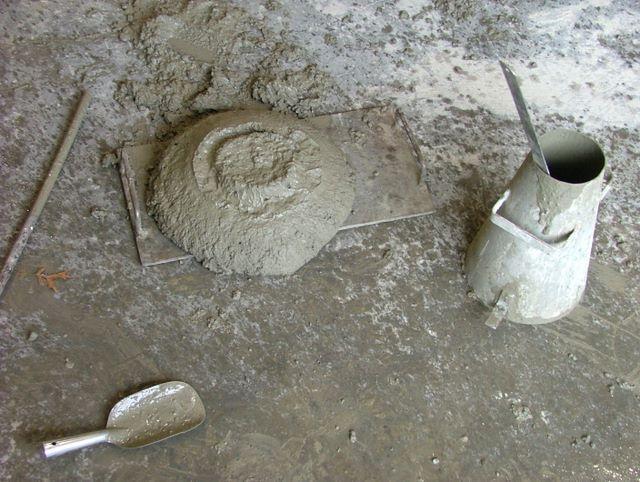
Figure 4-7 Concrete slump Test.
At the time of the pouring and the slump tests 18 sample concrete test cylinders were prepared, nine for each of the batches poured which correlated to three for each of the test units. These test cylinders were prepared and tested in accordance to New Zealand Standard Methods to Test for Concrete NZ 3112 Part 2 1986.
4.3.2 Construction Sequence
All of the construction and assembly of the test units took place in the University test Laboratory and began with the tying of the steel reinforcing cages. This process was undertaken in three main steps; firstly the central column section was assembled and through this the longitudinal D20H bars were inserted into their approximate locations. The overhead crane was then used to raise this sub-assembly into a position where the transverse reinforcement could be tied into position.
Following on from the completion of the reinforcement cages the required timber boxing was constructed. As stated in Section 4.2 the dimensions of the test units was largely governed by the existing boxing that was available in the laboratory. This meant that all that was required for the assembly of the boxing was the screwing together of the already pre-cut components, using 45mm zinc chromate countersunk screws at 500mm centres, and coating the interior with oil to assist with the removal of boxing once the concrete had sufficiently hardened. The boxing itself consisted of 75 x 50 framing timber and 20mm thick particle board and possessed sufficient strength as to ensure that deflections during the pouring of the concrete were negligible.
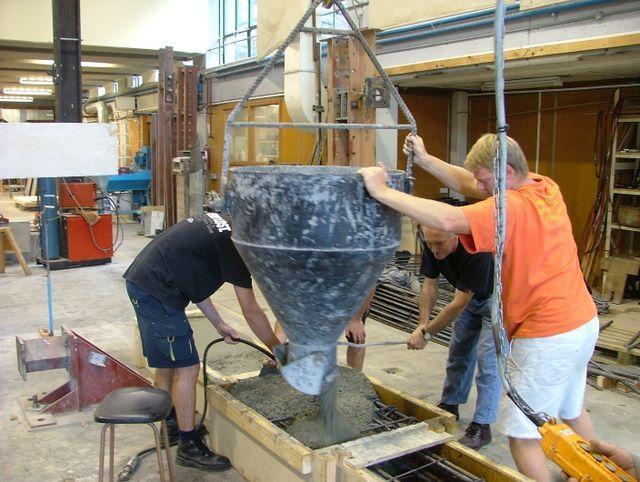
Figure 4-8 Pouring Concrete.
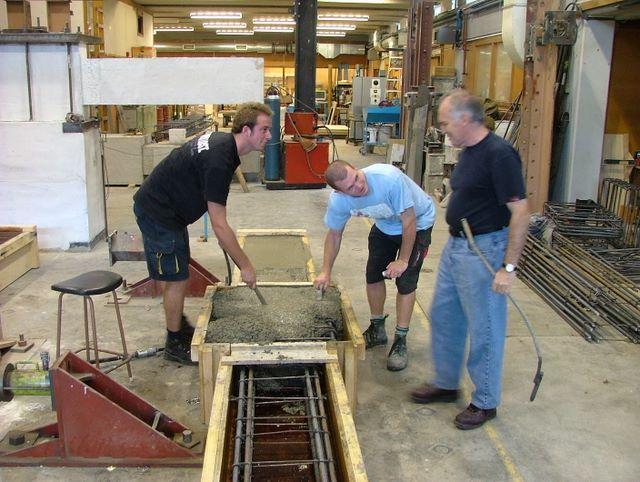
Figure 4-10 Concrete Placement and Finishing.
Using the overhead crane the reinforcement cages where positioned within the boxing and the concrete poured, once again by means of overhead crane and a large steel bucket, as illustrated in Figure 4-8. After vibrating the concrete to ensure that any air voids were removed and completing the concrete finishing work with hand screeds, Figure 4-9, the test units were covered with wet hessian, to reduce cracking, and left to cure.
4.4 Test Arrangement
Figures 4-11 and 4-12 detail the set-up arrangement that was used during the testing of the twelve beams. The test unit was placed symmetrically onto the concrete testing pedestal prior to testing using the overhead crane. Six stressing rods that passed up through the core of the pedestal and the outside of the central column section were used to tension down the test unit to the strong floor. The upper ends of the stress rods were fed through a 100mm thick RHS steel plate that was mortared into position onto the top of the column section, the rods were then each loaded to 245kN. By stressing down the test unit and restraining it into position any structural deformation that may have occurred due to fixed body rotation of the entire test unit was minimised. Although it should be noted that a small amount of rocking displacement did occur due to the elongation of the tensioning rods, this is detailed in Appendix A.
The chosen loading histories were applied to each of the beams using an actuator located at a distance of 1.55m from the column face and mortared into position, as can be seen in Figure 4-11. This distance is equal to half of the clear distance between column faces from the chosen design proto-type building structure, in order to simulate the ultimate deflection of the beam at mid-span. In the push direction the actuator had a load capacity of 490 kN and in the pull direction its capacity was 245 kN. Taking into consideration the fact that ten of the twelve loading histories involved in the testing schedule used cyclic load reversals, it was recognised that the lower of these two capacities, the pull direction, could possible limit the flexural strength of the beams. A check was made to ensure that the maximum probable demand placed upon the actuator during the application of the loading histories was below that of the lower capacity of 245 kN.
An overstrength factor of 1.3 was used to gain an estimate of the maximum probable demand to be;
which is well below the lower capacity of the actuator.
From Figure 4-11 it can be seen that the end of the test unit not connected to the actuator (hydraulic jack) was left completely unsupported. This was done in an effort to minimise the influence of force and strain transfer from the beam that was being tested into the second unsupported beam. To eliminate any tensional rotation of the beam being tested a steel bracing system was attached to the beam end as illustrated in Figure 4-12.
4.5 Instrumentation
During the construction of the test units, after the tying of the cages and prior to the pouring of the concrete, steel lugs were welded onto the longitudinal reinforcement at the locations detailed in Figure 4-13. The length of these lugs was sufficient to extend from the reinforcing steel out to surface of the concrete. Before the concrete was poured grease tape was wrapped around the lugs and length of plastic tubing inserted over the lug and grease tape. When sufficient time had passed for the concrete to cure the plastic tubing and grease tape was remove from the lugs to allow adequate clearance between the lug and the concrete cover. At the points where the lugs emerged from the concrete a network of displacement transducers (portal gauges); refer Figure 4-14, was attached to the beam face to measure relative displacements during the testing of the beam, as shown in Figure 4-13. The displacement readings taken from the transducers were collated using an HP data logger, which in turn allowed the calculation of the various displacement components; flexural, shear, and rocking as well as the reinforcement strains throughout the duration of the testing process, as detailed in Section 3.4. The displacement
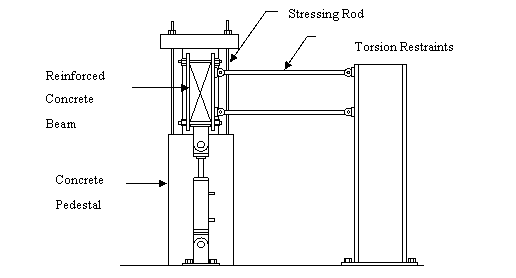
Figure 4-13 Instrumentation Layout
Three separate methods were used to measure and record the deflection of the free end of the beam, this was done in an effort to confirm the readings gained and to eliminate any uncertainties. The measurements were taken from the displacement reading from the actuator, a linear variable deflection transformer (LVDT) or turnpot, and manually through a steel rule connected to the end of the beam.
4.6 Separate Displacement Components
It was briefly noted above in Section 4.5 and covered in more detail in Section 3.4 that the displacement induced by the loading of the actuator was comprised of three separate components, these being; flexure displacement, shear displacement, and rocking displacement. By analysing the deformation data taken from the displacement transducer network and stored in the data logger these different components were able to be isolated
5.0 Applied Loading Histories (JS)
To compare the observed damage with the damage calculated using the five different damage indices proposed, a series of twelve different loading histories were applied to twelve nominally identical reinforced concrete beams.
Of the twelve loading histories, Section 5.1 describes four standard loading histories commonly applied in research institutes in the United States, Japan and New Zealand. Section 5.2 describes the three fabricated loading histories applied and Section 5.3 describes the other five which are displacement histories developed from a model simulation of the three story structure with varying ductility ratios and different sized earthquakes.
5.1 International Standard Loading Histories
The standard loading histories applied all over the world have been developed by research institutes in the United States, Japan and in New Zealand. Section 5.1.1 gives details of the New Zealand loading history. The conventional approach from the Public Works Research Institute in Japan is detailed in Section 5.1.2. Section 5.1.3 details the conventional approach form the PREcast Seismic Structural Systems (PRESSS) programme. The PRESSS programme employed a large number research institutes throughout the United States. The second loading history coming from the United States is taken from the University of California at Berkeley which is noted to be similar to loading histories applied at other Universities of California and is detailed in Section 5.1.4.
5.1.1 Conventional approach from New Zealand
The conventional New Zealand loading history was established in 1989 by Park (1989) at the University of Canterbury.
This was the first test performed during the testing process of our project as the first cycle provides means for the calculation of the ductility one displacement. The first cycle is force-controlled where the beam is loaded in both directions to ¾ of the theoretical nominal design strength Fn. Loading in both directions to the same force or displacement is termed a complete reverse cycle. The corresponding positive and negative displacements are noted and then averaged to find d’y. This average displacement is then extrapolated using a straight line approximation as shown in Figure 5-1 to where it intersects with the nominal design strength. The corresponding yield displacement, dy, at this point is then taken as the displacement at ductility one and has been used to describe six of the loading histories below.
The following cycles are displacement-controlled using this ductility one value obtained as a basis for the remainder of the testing. The ductility level is increased in increments of two, where two complete reverse cycles are applied at each level. This procedure is repeated until failure has occurred and is presented schematically in Figure 5-2.
5.1.2 Conventional approach from the Public Works Research Institute in Japan
As with the New Zealand loading history, the procedure adopted by the Public Works Research Institute in Japan consists of a force-controlled component and a displacement-controlled component. Figure 5-3 illustrates the procedure adopted by the Public Works Research Institute.
The force-controlled component consists of several increasing force complete reverse cycles. The initial force is 10% of the calculated yield force with the force then being increased in increments of 10% of the yield force until the yield force is reached.
Once the yield force is reached the loading is controlled by selected tip displacements that increase in single ductility increments and ten complete reverse cycles were conducted at each ductility level.
5.1.3 Conventional approach from the PRESSS Research Programme
The loading history adopted by the PRESSS research programme is based on storey drift. The initial drift level is 0.1% and the drift level is then increased in increments of 0.05% until 0.25%. The drift level is then increased in increments of 0.1%, 0.15%, and two increments of 0.5% until failure occurs. Calculated storey drifts are converted to ductility levels and three complete reverse cycles are completed at each drift increment. This is then followed by an intermediate complete reverse cycle within the elastic range which is calculated as 30% of the peak load reached in the proceeding three cycles. A schematic of the PRESSS loading history is shown in Figure 5-4.
5.1.4 Conventional approach from the University of California at Berkley
As for the New Zealand and the Public Works Research Institute loading history the conventional approach applied at the University of California at Berkley consists of a force-controlled regime and a displacement-controlled regime.
The first three complete reverse cycles are force-controlled and are calculated at ½ Fn, where Fn is the nominal yield force as calculated in Section 4.2.2.1.
Once yielding has occurred, the loading is controlled by selected tip displacements that increase in single ductility increments. Three complete reverse cycles at each ductility level are carried out to allow the degradation and stiffness at each ductility level to be calculated. This process is repeated until failure has occurred and a schematic of this is shown in Figure 5-5 below.
5.2 Fabricated Loading Histories
Three fabricated loading histories were applied for the experimental stage of this project, a Monotonic loading, Bi-directional Cycling at Ductility 3, and Uni-directional Cycling. Section 5.2.1 details the monotonic loading history, Section 5.2.2 details the bi-directional cycling at ductility 3 loading history, and Section 5.2.3 details the unidirectional cycling loading history.
5.2.1 Monotonic loading
A monotonic loading history as shown in Figure 5-6 below was applied to one of the test subassemblies for two reasons. The first reason is to establish the skeleton force displacement response of the test subassemblage. The second reason is because strength and deformation characteristics established form monotonic loading form the basis of several damage indices used later in this report.
This test consists of loading the beam in a single direction until failure has occurred.
5.2.2 Bi-directional Cycling at Ductility 3
Bi-directional Cycling at Ductility 3, as shown in Figure 5-7 below was conducted to give an indication of the fatigue characteristics of the test subassemblage.
This test simply consists of repeated complete reverse cycling at a ductility 3 until failure has occurred.
5.2.3 Uni-directional Cycling
The final fabricated loading history was the Uni-directional Cycling where the New Zealand loading history as described in Section 5.1.1 is applied in a single direction. This can be seen in Figure 5-8 below and is performed so that a comparison can be made between results from reversed cyclic loading and Uni-directional cyclic loading.
5.3 Earthquake Loading Histories
This section describes the five earthquake loading histories that were developed from non linear time history analyses of five 2D frame structures. The frames were designed to replicate the structure that our beam was designed to as mentioned in Section 4.1 above. Each three story, three bay frame consisted of columns with pinned basses designed to remain elastic and beams having identical properties to the beams as described in section 4.2.2 above and as obtained from the first New Zealand test described in Section 5.1.1.
Different scaled variations of the El Centro north-south record were then simulated through the individual frames where the masses of the floors were then adjusted to alter the period of each structure. The periods of each frame were altered to enable a reasonable variation in the ranges of deflections produced for the five different frames. Table 5.1 below summarises the scale factors applied to the El Centro north-south record with the corresponding period of each frame analysed.
|
Earthquake Loading History |
El Centro Earthquake Scale Factor |
Period of Structure (seconds) |
|
A |
2.0 |
1 |
|
B |
2.2 |
0.5 |
|
C |
3.8 |
0.31 |
|
D |
1.156 |
0.75 |
|
E |
2.075 |
0.75 |
Table 5-1 Summary of Earthquake Loading History Design Factors
Sections 5.3.1 through 5.3.5 give specific detail regarding the five different displacement sequences that were applied. All of the displacement sequences were displacement controlled and the entire history is carried out regardless of the subassemblage degradation
5.3.1 Earthquake Loading History A
Earthquake loading history A consisted of analysing the three story frame having a period of 1.0 second and scaling the North-South El Centro earthquake record by 2.0. Figure 5-9 below presents the displacement sequence for earthquake loading history A.
5.3.2 Earthquake Loading History B
Earthquake loading history B consisted of analysing the three story frame having a period of 0.5 seconds and scaling the North-South El Centro earthquake record by 2.2. Figure 5-10 below presents the displacement sequence for earthquake loading history B.
5.3.3 Earthquake Loading History C
Earthquake loading history C consisted of analysing the three story frame having a period of 0.31 seconds and scaling the North-South El Centro earthquake record by 3.8. Figure 5-11 below presents the displacement sequence for earthquake loading history C.
5.3.4 Earthquake Loading History D
Earthquake loading history D consisted of analysing the three story frame having a period of 0.75 seconds and scaling the North-South El Centro earthquake record by 1.156. Figure 5-12 below presents the displacement sequence for earthquake loading history D.
5.3.5 Earthquake Loading History E
Earthquake loading history E consisted of analysing the three story frame having a period of 0.75 seconds and scaling the North-South El Centro earthquake record by 2.075. Figure 5-13 below presents the displacement sequence for earthquake loading history E.
6.0 Results
The results from each of the tests are displayed in this section of the report. This includes a discussion of the test and procedure along with the damage indices and different crack sizes. Additional results and analysis are shown in Appendix A. Section 6.1 discusses the New Zealand test, 6.2 discusses the Japanese Public Works Research Institute test, 6.3 discusses the PRESSS test and 6.4 discusses the Berkley test. The Monotonic, Cycling at Ductility 3 and the Uni-directional cyclic tests are shown in Sections 6.5, 6.6 and 6.7 respectively, while the five earthquake tests are discussed in Sections 6.8 through to 6.12.
In most of the tests there were two dominant shear cracks that formed in the beam for both positive (pushing the beam up) and negative cycles (pulling the beam down). We used these cracks for comparison of the observed damage that occurred during testing. The chosen cracks can be seen below in Figure 6-1. These cracks were the consistent cracks in all of the tests and were primarily shear cracks.
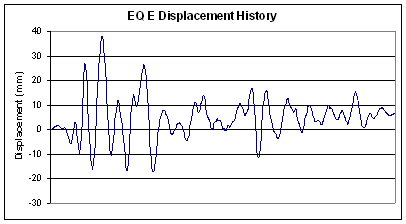
Figure 6-1. Location of the chosen cracks
For all of the tests the positive loading direction could hold more load than the negative loading direction. In most cases the positive loading direction would reach the yield force of the beam first. This would cause a yielding of the tension reinforcement in the positive cycle. This yielding would then decrease the size of the effective depth for loading in the negative direction. This reduction in effective depth would then cause a reduction in the maximum recorded strength in the negative loading direction.
It should be noted that the rocking displacement has not been removed from any of the force displacement plots shown in this section or in any of the subsequent sections. It is standard procedure to remove them, however the rocking displacement was deemed to be insignificant and therefore it was not removed.
6.1 New Zealand Loading History (NG)
This test was conducted in accordance with the New Zealand loading history. The beam was not able to complete all of the cycles at ductility 4. A large shear crack and hence a large amount of shear deformation occurred in the first negative cycle at ductility 4, which eventually lead to failure on the second positive cycle. The force displacement curve for this test is shown in Figure 6-2.
To find ductility 1 the beam was loaded to positive and negative 77 kN which is 75% of the nominal design force of the beam. In the positive direction the displacement was 7.0mm and in the negative direction the displacement was 5.5mm. This gave an average displacement of 6.25mm and hence a displacement at ductility 1 of 8.3mm. This value was used throughout the rest of the testing.
This beam has failed primarily due to shear. This is illustrated by the large amount of pinching that is evident in the hysteresis loops. There was also a considerable increase in depth of the beam, indicating the opening of large shear cracks throughout the beam. It is also evident that there is a significant amount of strength lost at each of the successive cycles at each ductility. Some of this strength is regained as the cycle moves onto the next ductility level.
From the information gathered it was possible to work out the different damage indices for the New Zealand loading history. These results are shown in Figure 6-3.
The two damage indices based on curvature reach failure at a very early stage in the test. This is because the greatest amount of curvature occurs at the beginning of the test and is then considerably smaller throughout the rest of the test as the shear based failure dominates the test. The much simpler damage index proposed by Cosenza et al. is very similar to the multifaceted damage indices of Park and Ang and Banon and Veneziano. These damage indices returned a value of approximately 0.6. This does not indicate that the beams have failed but the general trend is for the damage index to increase linearly with the cumulative ductility.
The shear crack that developed in the negative direction developed very rapidly. There is no development of crack D and a very late development of crack A in the positive direction. The development of the cracks is shown in Figure 6-4. There was a large amount of hairline cracks that formed during the testing process. Many of these were very small in nature and in the beginning part of the test could only be seen when the beam was loaded and did not grow significantly in width or length as the test progressed.
6.2 Public Works Research Institute (JB)
Presents the force-displacement response from testing using the Public Works Research Institute loading history and reveals that the beam reached a maximum ductility of also shows that the test exceeded the design force of 105 kN. The failure was indicative of shear failure described in Section 3.1 because of the large width of shear cracks present. During this test it was noted that at failure one of the shear reinforcing stirrups did not yield, because the hooks unwound off the longitudinal steel.
Figure 6-6 shows that when the test failed at ductility 3, the cumulative ductility was 87. Figure 6-6 also shows that the damage indices were not very accurate at predicting failure. The damage index proposed by Roufaiel and Meyer returned a value of 27 and was therefore was not accurate at predicting failure. The remaining damage indices returned values between 0.55 and 1.4, these indices would also not be useful in predicting damage. The most accurate index for this test was Bracci et al. which predicted failure at a cumulative ductility of 80, which was 1 cycle before failure actually occurred.
Shows that the primary and secondary cracks remained at approximately the same width until failure. Figure 6-7 also shows a significant increase in the shear cracks A, B and C just before failure. Immediately before failure the primary cracks A and B grew to between 9 and 10mm. However previous to this the largest cracks were between 3 and 5mm. At failure cracks A and B were between 7 and 11mm. This shows a good correlation between the amount of damage and the width of the cracks.
6.3 The PRESSS test (NG)
This test was completed to the PRESSS loading history. This test failed on the final positive cycle of 1. 5% inter-story drift, which equates to a ductility of 2.7. The force controlled part of the loading history had little effect and caused no extra damage to the beam. The force displacement curve is shown in Figure 6-8.
Most of this test is conducted within the elastic range and hence is largely dominated by flexural deformation. After this point the shear deformation starts to dominate the displacement. This is evident in the increased pinching in the larger displacement cycles.
The damage indices are calculated for this loading history and shown in Figure 6-9. Failure for this beam occurs at a much large cumulative ductility due to the large number of cycles conducted at a lower ductility. The damage index proposed by Roufaiel and Meyer fails early because the maximum measured curvature occurs early on in the test. The two curvature based models start to noticeably increase when the displacement exceeds the yield displacement (which occurs at a cumulative ductility of approximately 20). Again there are 3 damage indices that return very similar values; these are Banon and Veneziano, Park and Ang and Cosenza et al., that are well below zero at the point of failure. The most accurate damage index for the PRESSS loading history is that developed by Bracci et al. as it is closest to 1 one at the point of failure.
Measurable cracks started to develop once the displacement start to exceed the yield displacement. The width of the cracks was slightly dependent on whether the beam the beam had just completed a positive or a negative cycle. Cracks B and C are both the result of a negative cycle. These cracks developed first, but because a large number of cycles had already been conducted small shear cracks already existed for the positive cycle and these grew in width as the ductility approached 2. This is shown below in
6.4 Berkeley Loading History (JS)
Figure 6-11 below shows the force-displacement response of the beam subjected to the Berkeley loading history. On completing the first three complete reverse cycles at half the nominal design strength, the displacement at ductility one for the beam was calculated as for the New Zealand test. The value of Fn was calculated using the actual strength of the steel and concrete gathered from the testing of the samples taken and a corresponding displacement at ductility 1 of 7.86mm was obtained. This was similar to the value of 8.06mm obtained for the New Zealand test however the value of 8.06mm was used for the remained of the test to aid in the unity between results.
Failure has occurred on the positive stage of the second complete reverse cycle at ductility 4. At failure the flexural and shear components of displacements were relatively similar however it was observed at failure significant diagonal shear was the main failure mechanism. The main diagonal shear cracking formed close to the column face and had generally opened up to 8-10mm at failure.
Figure 6-12 below shows the comparison of the damages indices against cumulative ductility, also showing the point of failure. The Bracci et al. damage index predicted failure the best giving a value of 1 at failure. Although this prediction is perfect the progression of to damage up to this point is not as uniform as one would expect to occur from this standard test. It can clearly be seen from the hysteresis response that the degradation of the beam is occurring at a constant rate and therefore one would expect to see this uniformity in the prediction of the damage index. The Roufaiel & Meyer damage index predicts failure far to early. This is due to the way that the maximum curvature has occurred in the first cycles of the test (as can be seen in Appendix A-4) and therefore causing the curvature based damage index to perform badly. The Banon & Veneziano, Park and Ang and Cosenza et al. damage indices all tend to predict similar values around 0.5-0.6. All of the damage indices are considered to have performed poorly as they under predicted failure although showing a constant increase as the test progresses as one would expect.
Figure 6-13 below shows the progression of the four main cracks through out the test and shows the point of failure. All of the cracks grew at an increasing rate due to the degradation of the beam during the test cycles to failure where cracks A and B were generally 9-10mm and cracks C and D were around 5-6mm. A distinctive crack growth pattern is evident as the test progresses giving strong evidence of the relationship between the visual damage and the actual reduction in strength.
A significant increase in depth of the beam was observed as a result of the shear cracks forming and a plot of this is given in appendix A along with shear and flexure displacement plots.
6.5 Monotonic Lading History (BD)
Figure 6-14 illustrates the force-displacement response of the beam under applied Monotonic loading. It can be seen form this figure that the actual strength of the test unit was well in excess of the calculated nominal design strength of 105 kN. Throughout the test procedure an ultimate ductility of 10.5 was attained prior to the strength of the beam reducing to eighty percent of its maximum capacity. This ultimate ductility value is comparable with that obtained from the Uni-directional Cyclic loading history where ductility 10 was reached. As with the majority of the loading histories failure was attributably to the shear behaviour of the beam and in particular the yielding and rupture of the transverse reinforcement.
Figure 6-15 details the calculated damage indices from testing where Monotonic loading was applied. It reveals that all of the damage indices calculated accurately indicated that failure occurred in the test specimen at a time very similar to that given by the eighty percent reduction in strength, as indicated by the vertical dashed line. This however was to be expected as the ultimate value variables used in the calculations were taken from the test data and hence the results were normalised.
The observed damage that occurred is plotted in the form of progressive crack widths as shown in Figure 6-16. Unlike the other applied loading histories there was no cyclic component in the Monotonic test sequence and hence the resultant crack pattern was effectively halved with the elimination of the cracks for the negative (pull) cycles, cracks B and D. As illustrated in Figure 6-16 the crack behaviour is dominated by the large shear Crack A which developed in column end of the beam and steadily grew to a maximum width of 12mm during the test. The other minor crack group, in the outer regions of the beam, indicated by Crack C increased slightly during the initial stages of the load application then reached at limiting plateau at 0.5mm. The width of Crack A also increased gradually throughout the early stages of the test before levelling out in the vicinity of 6mm, it then once again began to widen just prior to failure when the maximum crack width was approximately 6.8mm.
6.6 Bi-directional Cycling at Ductility 3 (JB)
Figure 6-17 presents the force-displacement response from testing using the Bi-directional Cycling at Ductility 3 loading history and reveals that the beam completed 3 cycles at Ductility 3 before the beam failed on the negative reversal of the fourth cycle. Figure 6-17 also shows that the test exceeded the design force of 105 kN. The failure was indicative of shear failure described in Section 3 because of the large amount of shear cracks present.
Figure 6-18 shows that when the test failed, the cumulative ductility was 21. Figure 6-18 also shows that the damage indices were not accurate at predicting damage. The damage index proposed by Roufaiel and Meyer gave a failure value of 8.7 due to the large amount of curvature that was present in the early cycles. The other damage indices had values which ranged from 0.42 to 0.57. No damage indices were accurate enough to allow an appropriate damage index to be recommended for this test.
Figure 6-19 shows the cracks opening and closing as the beam cycles up and down. When the beam failed in the upwards cycle, the cracks A and C were being opened up and hence they are the biggest cracks at failure. The cracks that were being opened had widths ranging between 6 and 8mm, as the test approached failure and did not increase after failure had occurred.
6.7 The Uni-directional Cycling Test (NG)
This test was conducted in accordance with the Uni-directional cyclic loading history. The beam was able to achieve a considerably higher ductility before failure occurred because the loading was only occurring in one direction. The shear component of the measured displacement is insignificant compared to the flexural component. This is illustrated in the force displacement curve that is shown in Figure 6-20. Failure occurred in the second cycle at ductility 10 further showing that subsequent cycles cannot carry the same strength of the previous cycle.
The damage indices that were returned from the Uni-Direction Cyclic test are shown in Figure 6-21. It would be expected that for this test the damage indices would return values close to 1. This is true for all the damage indices apart from that proposed by Bracci et al. which reaches failure early on in the test. The damage index proposed by Roufaiel and Meyer is much more accurate because the curvature increases as the test proceeds, which suits this type of damage index. The damage indices proposed by Banon and Veneziano, Park and Ang and Cosenza et al. are all very similar and at failure they return a value of 1.2 at failure. These damage indices increase with each increase in cumulative ductility.
This test only involved positive cycles, as has been previously discussed. Hence cracks A and C are shear cracks and crack B represents the maximum of a series of flexural cracks. These flexural cracks were able to develop as there were no shear cracks in this region and the test was conducted to a much higher ductility than it would normally survive. At the end of the beam small shear cracks developed at the lower ductility’s. The width of the cracks that developed is shown in Figure 6-22.
6.8 Earthquake Loading History A (BD)
Figure 6-23 details the force-displacement response of the beam from testing using the Earthquake A loading sequence, from which it can be seen that the actual strength of the beam exceeded that of the nominal design strength. Unlike several of the other earthquake loading histories where the failure of the test specimen was not easily defined it can clearly be seen in Figure 6-23 that failure was definitely induced and considerable strength degradation was evident. The failure occurred during a positive load application due to the rupturing of the transverse reinforcement stirrups during the application of the eighth record in the displacement sequence at cumulative ductility of approximately 19. A significant reduction in the beam strength occurred after this and the greater displacements recorded beyond that point were a achieved with a much lower applied load.
Figure 6-24 illustrates the damage indices calculated from testing using the earthquake A loading history. Figure 6-24 reveals that the damage calculated as per Roufaiel and Meyer is drastically overestimated and does not give an accurate indication of failure. All of the other four indices also classified the test specimen as having failed but at a much more sensible manner. The Park and Ang, Cosenza, and Banon and Veneziano indices all follow a very similar path and predicted failure at a similar time to the reduction in strength reaching 80% of its capacity. This analogy was due to all of them being based largely on deformation, while the other two, Roufaiel and Meyer and Bracci et al. are primarily curvature based .
This presents the progressive development of the crack patterns by displaying the widths of the four main cracks. Unlike the monotonic loading history which lacked a cyclic component and hence had a more basic crack pattern the earthquake loading histories have cyclic displacements which occur at random. This cyclic behaviour is represented by the change and variation in the crack widths as the beam is either pulled down which generally results in an increase in width of cracks A and C, or pushed up where conversely closes cracks A and C while opening cracks B and D. From Figure 6-25 it can seen that the test specimen failed on the downward stroke of the actuator as represented by growth in the width of crack A and reduction in the width of crack B, both of which were large shear cracks. Crack B is constantly the largest throughout the test procedure, reaching a width of 13mm on the cycle prior to failure, which was to be expected as it originates in the area where the plastic hinge forms. Crack C however was somewhat comparatively larger than with the loading histories, this is due to the cyclic behaviour of the displacement history being centred about a displacement greater than zero, unlike in the other tests. Therefore the upwards cycles were constantly greater than those on the downwards strokes which explains the dominance of cracks B and C.
6.9 Earthquake Loading History B (JB)
Figure 6-26 presents the force-displacement response from testing using the Earthquake loading history B and reveals that the beam reached a maximum ductility of about 6.5. Figure 6-26 also shows that the test exceeded the design force. This failure was indicative of shear failure, as described in Section 3, because of the large shear crack which was formed. The test failed very early due to the large positive and negative displacement was present at the beginning of the loading history.
Figure 6-27 shows that when the test failed at ductility 6.5, the cumulative ductility was 17. Figure 6-27 also shows that the damage indices were reasonably accurate at predicting damage ranging from 0.8 to 1.15. The most accurate indices for this test were Bracci et al and Park and Ang which both predicted failure of 0.89. After failure the damage indices did not increase significantly which is what was observed during testing.
Figure 6-28 shows the huge increase in the dominant crack B at failure. At this point all other cracks were closed as the deflection of the beam was absorbed by crack B. Figure 6-28 also shows the increase in width of the other cracks after failure. Before failure no cracks were bigger than 4mm. At failure the only significant crack was 25mm, however after failure cracks A and C had values of around 10mm.
6.10 Earthquake Loading History C (BD)
In contrast to the response generated by the more controlled laboratory derived loading histories those induced during the application of the earthquake loading history did not necessarily result in the failure of the test unit. This is evident in Figure 6-29 which presents the force-displacement response from testing using the Earthquake C loading sequence. During this test the maximum displacements generated, the greatest of which was less than 30mm, were considerably less than those induced during the laboratory loading histories, as a result the required applied force was also significantly reduced. This can be seen in Figure 6-29 where the maximum applied load is only slightly greater than the nominal design strength. The majority of these minor displacement cycles occurred throughout the latter stages of the test and hence forces required were never large enough to be limited by the eighty percent reduction in strength required for failure. Therefore it was difficult to determine and define when or if significant degradation of the beam strength had occurred when considering the forces applied. It should also be noted that the applied positive forces were significantly greater than the applied negative forces. This is due to two factors, the first being the initial stiffening of the tension steel on the early positive cycles as detailed in Section 6.0 and secondly due to the nature of the acceleration history which required the cyclic reversals to be centred about a point greater than zero.
Figure 6-30 details the damage indices calculated from testing using earthquake loading history C. As with the prior earthquake results the damage predicted by Roufaiel and Meyer is significantly greater than was expected, as was the damage calculated using the index proposed by Bracci et al., both of which show significant damage development early in the test. This behaviour can be attributed to the large amount of curvature developed in the early stages of the test sequence. Once again the values returned by the remaining three indices were very similar with none of them predicting failure in the beam. Although the they appear to level out at similar value, with Park and Ang being slightly higher, the initial portion of the plot which details the increase and development of the majority of the damage is slightly different for all three cases. The lack of damage predicted in the latter portions of the test was attributable to fact the all of the largest displacement cycles occurred near the beginning of the loading history.
This trend indicating the bulk of damage occurring in the initial stages of the test is supported by the development of the crack widths shown in Figure 6-31. It can be seen that the majority of the growth in all four of the main crack groups took place during the early larger displacement cycles. As expected the pattern displayed shows the recurring opening and closing of cracks A and C, and cracks B and D with the induced cyclical displacements. Also the shear dominant cracks A and B which formed in the plastic hinge zone are noticeably larger, attaining maximum widths of 9mm and 10mm respectively.
6.11 earthquake Loading History D (JS)
Figure 6-32 below shows the force-displacement response for the earthquake loading history D test. Failure occurred during a large negative cycle of displacement of 64mm, approximately equal to ductility 8. Although prior to this failure cycle it is evident that cycles have been completed and not reached 80% of the maximum strength, this does not necessarily mean that failure has occurred. These cycles are all still fairly elastic and therefore there can be no conclusion made to the failure of the beam at these locations.
Figure 6-33 below shows the comparison of damage indices calculated for this test. The damage indices predict the failure quite accurately, except for the Bracci et al. and Roufaiel & Meyer indices. This is because these take into the effect of cyclic effects and therefore the dissipated energy, caused by the numerous cycles in the elastic region is the basis for the pre-mature failure.
6.12 Earthquake loading History E (JS)
Figure 6-35 below shows the force-displacement response for the earthquake loading history E test. For earthquake E failure occurred at the end of the test as can be seen from the final negative cycle showing the beam is yielding and has lost 80% of its maximum strength. This earthquake loading history therefore shows the damage inflicted on a beam having a large number of smaller cycles prior to its failure. Therefore the results obtained from this test will be useful in comparing the overall results as they give one of the extreme ranges as opposed to a test to a test failing due to a small number of larger cycles for example.
Figure 6-36 above shows the comparison of damage indices for the earthquake loading history E test. The Bracci et al. and Roufaiel & Meyer damage indices tend to show pre-mature failing where the other three indices tend to predict the failure perfectly. The reason for Roufaiel and Meyer and Bracci et al. to fail in predicting failure is due to the fact that these damage indices are based on the curvature of the beam as well as the dissipated energy. As can be seen in Appendix A-12 the maximum curvature for this test has occurred relatively early on and also the dissipated energy is largely variable due to the number of cycles completed within a fairly elastic range.
Figure 6-37 below shows the development of the main cracks throughout the earthquake E testing process. This beam at failure showed a large number of smaller shear cracks forming contributing to the failure at the end of the test. The crack widths at failure are around 8-10mm for cracks A and B and around 2-3mm for cracks C and D. A distinct growth pattern can also be observed as the test progresses showing a distinct relationship between the crack size and the strength deterioration.
7.0 Comparison of Results (NG, JB, JS, BD)
There are a number of comparisons that can be made between the different tests and their subsequent loading histories. Comparisons between the different laboratory loading histories are presented in Section 7.1, 7.2 shows the comparison of the laboratory tests with the earthquake loading histories. Section 7.3 discusses the ability of damage indices to predict failure. Section 7.4 discusses the ability of damage indices to reflect observed damage, and other methods to reflect observed damage are covered in section 7.5. Figure 7-1 below identifies the location of the dominant crack patterns that formed during testing, these can be categorised as being either primary, cracks A and B, and secondary, cracks C and D. Hereafter the larger of cracks A and B shall be referred to as the primary crack and the larger of cracks C and D shall be referred to as the secondary crack.
7.1 Comparison of the Laboratory Loading Histories
These tests included the four standard loading histories along with the Monotonic, Uni-directional cycling and Cycling at Ductility 3 loading histories. Failure load and deflection is discussed in Section 7.1.1, the different damage indices in Section 7.1.2 and the crack widths in Section 7.1.3
7.1.1 Failure Load and Displacement
There is a correlation between the failure load and the failure displacement. The loading histories with both positive and negative displacement cycles have very similar failure loads and failure displacements. The loading histories with only positive displacements also have similar failure loads and displacements. The failure displacements are significantly higher for the loading histories having only positive cycles where also the failure forces are also marginally higher.
Even though the New Zealand loading history has a low number of cycles, and the cycles increase in relatively large ductility steps, the failure load and failure displacement are similar to the other reversing cyclic loading histories. These other reversing cyclic loading histories have a higher number of cycles before failure of the beam occurred.
7.1.2 Damage Indices
The loading histories from the Public Works Research Institute (PWRI), New Zealand, PRESSS, Berkeley and Cycling at Ductility 3 all returned similar damage indices from Cosenza et al., Park and Ang and Banon and Veneziano. The damage index proposed by Bracci et al. follows a similar trend to the above damage indices while predicting significantly greater damage at failure. The damage index proposed by Roufaiel and Meyer is highly variable for each of the different loading histories.
For the loading histories with only positive cycles, Monotonic and Uni-directional, all the damage indices returned values close to 1, with the exception of Bracci et al. during the Uni-directional loading history.
7.1.3 Crack Widths
In general the primary crack was observed to be at least 6.5mm in width at failure for all of the standard laboratory tests. The secondary crack for the reversing cyclic tests (PWRI, NZ, PRESS, Berkeley and Ductility 3) were observed to be at least 2mm in width at failure. The Monotonic and Uni-directional loading histories show an observed secondary crack width of less than 0.5mm. The increase in depth within the primary crack region, with the exception of the Monotonic test, gives a fairly accurate representation of the cumulative shear crack width within the region Therefore giving a good confirmation of a minimum crack width of around 6.5-8mm which was observed at failure. The size of the primary and secondary cracks at failure for the standard and the fabricated loading histories along with the increase in depth at failure is shown in Table 7-1.
|
Primary Crack |
Secondary Crack |
Increase in Depth |
|
|
PWRI |
11 |
6 |
8.5 |
|
NZ |
20.0 |
10 |
15 |
|
PRESSS |
9.7 |
2 |
7.8 |
|
Berkeley |
7.8 |
5.3 |
7.7 |
|
Monotonic |
6.8 |
0.5 |
2.9 |
|
Uni-Directional |
7 |
0.2 |
5.4 |
|
Ductility 3 |
6.5 |
2.5 |
6 |
Table 7-1 Crack widths and Increase in Depth for Standard Laboratory Tests at Failure
7.2 Comparison between the Laboratory tests and the Earthquake Loading Histories
It is important to establish whether there is any comparison between the laboratory loading histories and the earthquake loading histories. This comparison can be made using the displacements and loads (discussed in Section 7.2.1), the damage indices (discussed in Section 7.2.2) and the crack widths (discussed in Section 7.2.3) at failure. Earthquake C did not fail during the application of the loading history (as is discussed in Section 6.10) so therefore is not included as part of this comparison.
7.2.1 Failure Load and Displacement
The failure loads for the earthquake tests are comparable to the laboratory tests. Earthquake A has a comparable failure displacement to the Monotonic and Uni-directional loading histories. Earthquakes B, D and E have failure displacements that are approximately 70% higher than that of the reversing loading histories.
7.2.2 Damage Indices
Apart from the damage index proposed by Roufaiel and Meyer, the damage indices were approximately 60% higher for the earthquake loading histories than those returned for the laboratory loading histories. As with the laboratory tests the damage indices proposed by Cosenza et al., Park and Ang and Banon and Veneziano all predicted similar damage values at failure for the earthquake tests.
7.2.3 Crack Widths
In general the primary crack was observed to be at least 8.8mm in width at failure for all of the earthquake tests. The secondary crack widths observed for earthquake tests show a wide variation therefore making a comparison within the secondary region was difficult. The increase in depth reflects a fairly good representation of the shear crack width in the primary region and therefore gives a good confirmation of a minimum primary crack width of around 8-10mm observed at failure.
When comparing the crack width and increase in depth of the primary crack region from the standard laboratory tests to those from the earthquake tests there is a good relationship with regards to the minimum crack width. The secondary cracks recorded show no real comparison between the crack widths at failure, however it was observed that there was a similar spread of crack widths ranging from 0-10mm. The size of the primary and secondary cracks at failure for the earthquake loading histories along with the increase in depth at failure for the tests is shown in Table 7-2.
|
Primary Crack |
Secondary Crack |
Increase in Depth |
|
|
EQA |
8.8 |
9.2 |
9.9 |
|
EQB |
25 |
0.1 |
14 |
|
EQC |
9.5 |
7 |
4.5 |
|
EQD |
20 |
2 |
10.3 |
|
EQE |
11 |
6.5 |
9.7 |
Table 7-2 Crack widths and Increase in Depth for Earthquake Loading History Tests at Failure
7.3 The Ability of Damage Indices to Reflect Failure
The predicted damage returned by the Roufaiel and Meyer damage index at failure is discussed in Section 7.3.1, Bracci et al in Section 7.3.2, Park and Ang in Section 7.3.3, Cosenza et al. in Section 7.3.4 and Banon and Veneziano in Section 7.3.5. The aim is to find the damage index that is best suited to this particular beam design.
7.3.1 Roufaiel and Meyer
The Roufaiel and Meyer damage index does not accurately predict the failure of the beam. It shows significant development of damage during the early stages of the tests and prematurely predicts the failure of the beam. This is because the largest curvature occurs during these early stages. However the rate of increase in the predicted damage decreases during the later stages of the tests when shear deformation becomes dominant.
7.3.2 Bracci et al.
For the laboratory tests this damage index returned the damage value closest to 1 at failure. It was not as accurate at predicting failure for the earthquake loading histories as it was highly variable ranging between 0.9 and 1.45.
For some of the loading histories the Bracci et al. index would return a fairly accurate failure value early on in the test. This value would then remain constant for the remainder of the test. Therefore the Bracci et al. index did not give an accurate representation of the damage of the beam throughout the entire test.
7.3.3 Park and Ang
The damage index proposed by Park and Ang was the most accurate for the earthquake loading histories. It returned values that varied between 0.8 and 1.1, so therefore was relatively consistent. For earthquake C the damage index was 0.4, which was considerably lower than the other earthquakes which all failed.
This damage index is not as accurate for the laboratory loading histories. For the Public Works Research Institute, Monotonic and Uni-directional loading histories the value was in excess of 1. For the New Zealand, PRESSS and Berkeley loading histories the damage indices ranged from 0.36 to 0.63.
Therefore the Park and Ang damage index was inconsistent in predicting failure.
7.3.4 Cosenza et al.
Apart from the Monotonic and the Uni-directional loading histories the value returned at failure was always less than 1. For all of the loading histories apart from the Monotonic and Uni-directional cyclic, this damage index was very constant ranging between 0.44 and 0.6. For the earthquake tests it was also consistent although slightly higher ranging between 0.77 on 0.98. These values all indicate that failure has not occurred. This model only predicts that the Monotonic, Uni-directional and Earthquake A loading histories had failed.
This damage index is the simplest of the damage indices that has been discussed. Despite its simplicity it still returns values that are with a similar range to the much more complicated damage indices proposed by Park and Ang and Banon and Veneziano.
7.3.5 Banon and Veneziano
The damage index proposed by Banon and Veneziano returned a value very similar to that returned by Cosenza et al. and therefore has the same degree of accuracy of predicting damage at failure as Cosenza et al. does.
7.3.6 Summary of Damage Indices
From all of the comparisons it can be seen that the damage index proposed by Bracci et al was in general the most accurate at predicting failure. However for the purposes of predicting damage accurately we do not consider that any of the above damage indices are accurate enough because the values were not consistently within an acceptable range at failure.
7.4 The Ability of the Damage Indices to Reflect Observed Damage
There was no damage index that returned a consistent or accurate value (as is discussed above in Section 7.3) at failure for all of the tests. This is because no damage index gave us a reliable prediction of failure we are not able to use a damage index as a basis for damage states which would reflect observed damage.
7.5 Other Methods to Reflect Observed Damage
There are three methods for describing the observed damage of the beams, these are; via crack patterns as illustrated in Section 7.5.1, crack widths as compared in Section 7.5.2 and damage states as covered in Section 7.5.3.
7.5.1 Crack Patterns
When the crack patterns at failure are compared it can be seen that there are two distinct patterns present. The first is the singular large dominating shear crack formed during a loading history that has a small number of generally very large displacement cycles prior to failure. These included the New Zealand, Earthquake A, B and D loading histories. The second is the crack pattern formed during the loading histories with a large number of generally smaller displacement cycles before failure. This crack pattern is more symmetrical and typically has smaller crack widths. These tests included the PWRI, PRESSS, Berkeley and Earthquake E loading histories. The remaining loading histories did not fit into either of these categories because of the nature of the loading history.
7.5.2 Crack Widths
This shows the width of the cracks in the primary and secondary zones throughout the progression of the Public Works Research Institute test. From this graph it can be seen that the width of the cracks drastically changes as the test approaches failure. It can therefore be concluded that the width of the cracks can be used to represent the amount of damage the beam has sustained. As previously compared (Sections 7.1.3 and 7.2.3) the increase in depth of the beam also shows a good correlation to the increase in crack width and hence the amount of damage to the beam.
7.5.2 Damage States
Although we could not use damage indices to reflect failure it was possible to use data gathered during testing to predict observed damage. Damage states have been proposed by various researchers as a useful way to quantify the observed damage of the beam (see Section 2.0). By analysing laboratory data (photos, test results, crack measurements and written observations) four separate damage states for our particular beam detailing were prepared, as shown in Table 7-3. For a beam to fall into a damage state it must not exceed any of the damage conditions that have been proposed for that state.
|
Damage State |
Damage Conditions |
|
No Damage |
Only hairline flexural cracks (<0.5mm) No shear cracks present. |
|
Repairable |
Shear cracks less than 2mm. Localised spalling not being greater than 40mm across. |
|
Irreparable |
Shear cracks 2-6.5mm. Spalling does not expose reinforcing steel. An increase in beam depth of not greater than1%. |
|
Structure Unsafe |
Shear Cracks >6.5mm. Spalling exposing reinforcement. Cracks progress all the way through the width of the beam. |
Table 7-3 Criteria for damage states
The state of ‘No Damage’ is classified as being when the beam is still within the elastic stage and has not exceeded half of the nominal yield strength. It can be observed from Figure 7-3 that only small flexural cracks have developed.
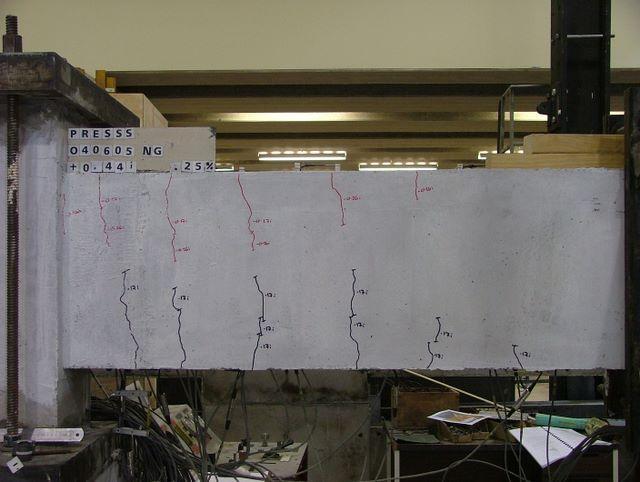
Figure 7-3 No Damage State
The next state of damage is ‘Repairable’. At present there is enough knowledge to know the limits at which beams that are damaged in flexure can be repaired. However there is little knowledge on the effects of shear damage and the ability for it to be repaired. Therefore we have made the conservative assumption that at a repairable state there has been minimal shear damage to the beam. In the repairable state the beam may have yielded and it may start to show visible signs of damage, however there will have been only a diminutive amount of structural damage to the beam at this stage. Most importantly there will have been little contribution to this damage by shear. As previously mentioned the increase in depth of the beam gives a good indication of the width of shear cracks formed and hence the amount of shear damage. From the comparison of Figure 7-7 and Figure 7-9 we can observe that the fraction of shear damage at the repairable state is small compared to that at failure. A beam in a repairable state of damage may have developed shear cracks which are less than 2mm. At this state of damage localised spalling may have begun to deteriorate the face of the beam as can be observed in Figure 7-4.
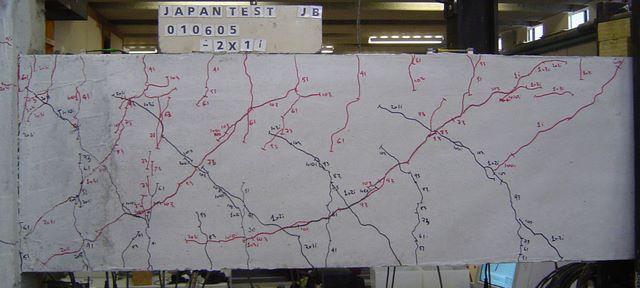
Figure 7-4 Repairable State
As the ductility increases the beam loses strength and falls into the ‘Irrepairable’ category. The beam has now lost significant strength and shear damage has become more substantial. By comparing Figure 7-7 and Figure 7-8 the significant change in increase in depth from the repairable state can be seen. This increase in depth can be measured to be less than 1% of the initial depth of the beam. It can be observed in Figure 7-5, that notable spalling and sizable shear cracks have developed further from the repairable state.
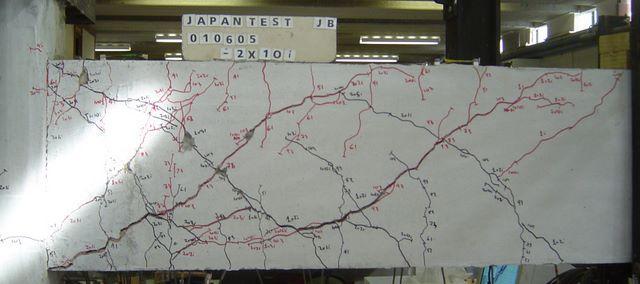
Figure 7-5 Irrepairable State
The final state is ‘Structure Unsafe’. After an earthquake a structure in this state will have lost a substantial amount of its pre earthquake strength. The structure is termed unsafe once its strength has been reduced to 80% of the maximum strength recorded during testing. Even with this loss of strength the building may still be standing. However if another earthquake or significant after shock were to occur, the building would be very likely to sustain fatal damage resulting in the ultimate collapse of the building. Therefore a building that is classified as ‘Structure Unsafe’ should not be entered during a period of heightened seismic activity. Figure 7-6 shows a structurally unsafe beam, it can observed that there is cracking greater than 6.5mm which represents the minimum width of failure cracking as detailed in Section 7.1.3 and Section 7.2.3.
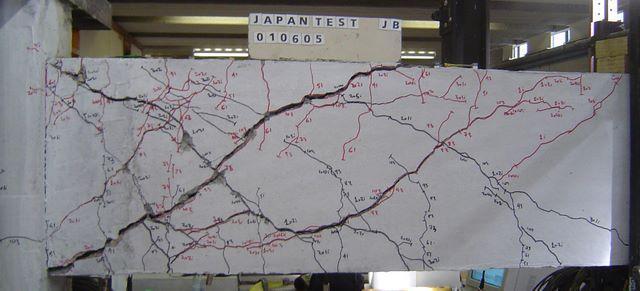
Figure 7-6 Structure Unsafe State
8.0 Conclusions (NG, JB, JS, BD)
This chapter is comprised of a summary of findings of the literature review (Section 8.1.), gives conclusions drawn from the results obtained from the testing (Section 8.2) and states the conclusions drawn from the comparisons of the results (Section 8.3).
8.1 Literature Review
1. Park and Ang is the most widely used and compared damage index.
2. Research has shown that the appropriateness of the different damage indices varies depending on the applied loading history and the nature of the reinforced concrete structure being tested.
3. Damage indices range from those based upon displacement, such as the ductility and Cosenza et al. to those based solely on curvature, such as Roufaiel and Meyer, to much more complex and multi facetted, such as Park and Ang, Banon and Veneziano and Bracci et al.
4. Damage indices are now being adapted into computer models such as IDARC.
8.2 Results
1. Shear force values obtained at failure during testing were considerably less than the calculated nominal shear strength from the pre 1972 design. The effects of shear failure were not fully understood in pre 1970’s reinforced concrete design and this caused premature shear failure during testing.
2. From the force-displacement response curves it can be seen that in all cases (except Earthquake C which did not fail) the actual strength of the test unit was in excess of the nominal design strength.
3. For all of the tests with positive and negative cycles (except earthquake B) there was a considerable difference between the maximum positive and negative force measured. This difference was due to stiffening in the tension reinforcement causing a reduction in the effective depth and therefore a reduction in the maximum strength capacity of the member in the negative direction.
4. The rocking deflection calculated during testing was considered to be negligible with respect to the results documented as part of this report.
5. Flexural deflection was dominant in the pre yield period of the tests, after yield shear deflection became dominant and ultimately led to the failure of the beam in shear.
6. Flexural deformation was the major contributor to the deflection on the positive cycles and shear deformation was the major contributor on the negative cycles.
7. The maximum curvature occurred at the beginning of the tests excepting the Monotonic and Uni-directional loading history. After this point the curvature decreased due to the decline in flexural deformation.
8.3 Comparison of results
1. There was no damage index that could accurately and consistently predict the failure of the beam for all the tests conducted. There is scope for further work to be conducted in this area to find a damage index that is appropriate for beams that fail in shear.
2. The Bracci et al. damage index did manage to predict the failure of the beams better than the other damage indices. However Bracci et al. often showed premature failure resulting in a more conservative damage index value. Generally this damage index levelled off at the failure point rather than increasing, which would have been expected.
3. The Roufaiel and Meyer damage index was not at all suitable for the form of testing and the beam detailing that was used.
4. The damage indices proposed by Park and Ang, Cosenza et al. and Banon and Veneziano all returned similar damage indices for the different tests. They also tended to underestimate the damage index at failure.
5. The crack patterns formed during the New Zealand loading history was similar to those from the earthquake loading histories A, B and D. These loading histories consisted of small number of large displacement cycles prior to failure.
6. The crack patterns formed during the Public Works Research Institute, PRESSS and Berkeley loading histories are similar to those formed during the earthquake loading history E. These loading histories consisted of a large number of completed cycles before failure.
7. The primary crack widths for the standard laboratory loading histories at failure were greater than 6.5mm.
8. The primary crack widths for the earthquake loading histories at failure were greater than 8.8mm.
9. The increase in depth of the primary crack region gave an accurate indication of the width of the primary crack for both the laboratory and the earthquake loading histories.
10. The secondary cracks observed for both the laboratory and the earthquake loading histories showed no similarities at failure, however they were all within the range of 0-10mm.
11. Although it was not feasible to use damage indices to reflect failure it was possible to use data gathered during testing to predict observed damage in the form of damage states. Damage states proposed are No Damage, Repairable, Irrepairable, and Structurally Unsafe.
9.0 References
Banon, H., and Veneziano, D. (1982). “Seismic Safety of Reinforced Concrete Members and Structures.” Earthquake Engineering and Structural Dynamics, 10, pp. 179-193.
Bracci, J. M., Reinhorn, A. M., Mander, J. B., and Kunnath, S. K. (1989). “Deterministic Model for Seismic Damage Evaluation of Reinforced Concrete Structures.” Technical Report NCEER, 89-0033.
Chung, Y. S., Meyer, C. and Shinozuka, M. (1987) “Seismic Damage Assessment of Reinforced Concrete Members.” Technical Report NCEER, 87-0022.
Chung, Y.S., Meyer, C., and Shinozuka, M. (1989) “Modeling of Concrete Damage.” ACI Structural Journal, 86(3), pp.259-271.
Cosenza, E., Manfredi. G., and Ramasco, R. (1993). “The Use of Damage Functionals in Earthquake Engineering: A Comparison Between Different Models.” Earthquake Engineering and Structural Dynamics, 22, pp. 855-868.
DiPasquale, E. and Cakmak, A. S. (1988). “Identification of the Serviceability Limit State and Detection of Seismic Structural Damage.” Technical Report NCEER, 88-0022.
GeoNet Project, The – Monitoring Geological Hazards in New Zealand. [Online]. Available: http://www.geonet.org.nz/
Ghobarah, A., Abou-Elfath, H. Biddah, A. (1999) “Response-Based Damage Assessment of Structures.” Earthquake Engineering and Structural Dynamics, 28, pp. 79-104
Gosain, N. K.; Brown, R. H. and Jirsa, J. O. (1977) “Shear requirements for load reversals on RC members”, ASCE Journal of the Structural Division, v 103, n 7, 1461-1476
Gunturi, S.K. (1992). “Building Specific Earthquake Damage Estimation.” Ph.D. Thesis submitted to Stanford University.
Hatamoto, H., Chung, Y. S., and Shinozuka, M. (1990). “Seismic Capacity Enhancement of R/C Frames by Means of Damage Control Design.” Proceedings of Fourth U.S. National Conference on Earthquake Engineering, 2, pp. 279-288.
Hwang, T. H. (1982). “Effects of variation in Load History on Cyclic Response to Concrete Flexural Members.” PhD Thesis, Department of Civil Engineering, University of Illinois, Urbana.
Kanaan, A.E. and Powell, G.H. (1973) “DRAIN-2D – A General Purpose Computer Program for Dynamic Analysis of Inelastic Plane Structures”, Report No. UCB/EERC/73/06 and 73/22, University of California, Berkeley.
Kratzig, W.B, Meyer, I.F., and Meskouris, K. (1989). “Damage Evolution in Reinforced Concrete Members Under Cyclic Loading.” Proceedings of 5th International Conference on Structural Safety and Reliability, San Francisco, U.S.A., 2, pp. 795-802.
Kunnath, S.K., and Reinhorn, A.M., (1994), “IDARC2D Version 3.1: Inelastic Damage Analysis of RC Building Structures, Users Manual.” Department of Civil Engineering, State University of New York at Buffalo, September.
Kunnath, S.K., Reinhorn, A.M. and Lobo, R.F. (1992) “IDARC Version 3.0: A Program for the Inelastic Damage Analysis of Reinforced Concrete Structures”, Technical Report 92-0022, National Centre for Earthquake Engineering Research, State University of New York, Buffalo NY.
Kunnath, S. K., El-Bahy, A., Taylor, A. and Stone, W. (1997) “Cumulative seismic Damage of Reinforced Concrete Bridge Piers”, Technical Report 97-0006, National Centre for Earthquake Engineering Research, State University of New York, Buffalo NY.
Lau, D. (2000). “The Influence of Precast-Prestressed Flooring on the Seismic Performance of Reinforced Concrete Perimeter Frame Buildings.” Master of Engineering Thesis, Auckland University.
Liddell, D. (2000). “Influence of Loading History on Ultimate Displacement of Concrete Structures.” Master of Engineering Thesis, Auckland University.
Ma, S-Y. M., Bertero, V. V., and Popov, E. P. (1976). “Experimental and Analytical studies on the Hysteretic Behavior of Reinforced Concrete Rectangular and T-Beams.” EERC University of California, Berkley, 76-2.
Ministry of Works. (1970). “Code of Practice for the Design of Public Buildings (P.W. 81/10/1: May 1970).”
New Zealand Standards Authority. (1965). “NZS1900 Model Building By-law.”
New Zealand Standard Authority. (1993). “NZS4203 Standard Loadings Code.”
Park, R. (2001) “Improving the resistance of structures to earthquakes”, Bulletin of the New Zealand Society for Earthquake Engineering, Vol. 34, No. 1, 1-39.
Park, Y. J., Ang, A. H.-S. (1985). “Mechanistic Seismic Damage Model for Reinforced Concrete.” ASCE Journal of Structural Engineering, 111(4), pp. 722-739.
Park, Y.J., Ang, A.H-S. and Wen, Y.K. (1987) “Damage-limiting aseismic design of buildings”, Earthquake Spectra, Vol. 3, No. 1, 1-26.
Park, Y, -J., Reinhorn, A.M., and Kunnath, S.K. (1987), “IDARC: Inelastic Damage Analysis of Reinforced Concrete Frame-Shear-Wall Structures.” Technical Report NCEER -87-0008.
Popov, E. P., Bertero, V. V., and Krawinkler, H. (1972). “Cyclic Behaviour of Three RC Flexural Members with High Shear.” EERC University of California, Berkley, 72-5.
Roufaiel, M. S. L., and Meyer, C. (1987). “Analytical Model of Hysteretic Behavior of R/C Frames.” ASCE Journal of Structural Engineering, 113(3), pp. 429-444.
Russell, A. (2005). ). “FRP Retrofit of Inadequately Reinforced Concrete Beam-Column Joints – Part A.” Fourth Year Civil Engineering Project Report, Auckland University.
Singhal, A, and Kiremidjian, A.S. (1995). “Method for Developing Motion Damage Relationships for Reinforced Concrete Frames.” Technical Report NCEER-95-0008.
Speed, C. (2005). “FRP Retrofit of Inadequately Reinforced Concrete Beam-Column Joints – Part B.” Fourth Year Civil Engineering Project Report, Auckland University.
Stone, W.C. and Taylor, A.W. (1993) “Seismic performance of circular bridge columns designed in accordance with AASHTO/CALTRANS standards”, NIST Building Science Series 170, National Institute of Standards and Technology, Gaithersburg MD.
Williams, M. S., and Sexsmith, R. G. (1995). “Seismic Damage Indices for Concrete Structures: A State-of-the-Art Review.” Earthquake Spectra, 11(2), pp. 319-349.
Williams, M. S., Villemure, I., and Sexsmith, R. G. (1997). “Evaluation of Seismic Damage Indices for Concrete Elements Loaded in Combined Shear and Flexure.” ACI Structural Journal, 94(3), pp. 315-322.
Appendix A: Results and Analysis
The results and analysis from each of the tests are displayed in Appendix A. This includes a break down of the different components of displacement and the elongation and ‘fattening’ of the beam. Photographs of the beam as the test proceeded are shown to better display the crack pattern. Section A.1 discusses the New Zealand test, A.2 discusses the Public Works Research Institute test, A.3 discusses the PRESSS test and A.4 discusses the Berkley test. The Monotonic, Cycling at Ductility 3 and the Uni-directional cyclic tests are shown in sections A.5, A.6 and A.7 respectively, while the five earthquake tests are discussed in sections A.8 through to A.12.
For some of the graphs analysis is undertaken for each of the different panels in the spider web. The location of these panels is shown below in Figure A-1.
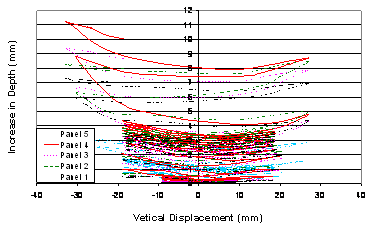
Figure A-1. Location of the different panels for the spider web
A-1 The New Zealand Loading History
In the following pages are a number of graphs that were produced as part of the analysis conducted for the test conducted to the New Zealand loading history. Figure A-2 shows the elongation of the beam and Figure A-3 shows the increase in depth of the beam for each of the individual panels. The central three panels show the largest increase in depth, this is the area that the large shear crack opened up. This is also reiterated by Figure A-4 shows the shear deflection for each of the individual panels with the central three panels having the largest shear. Figures A-5 and A-6 shows the total shear and flexural deflection respectively. The beam had greater flexural deflection on the positive cycles than the negative cycles and the shear deflection was larger in the negative cycle. Figure A-7 shows the comparison of the calculated deflection and the actual deflection in the form of the loading history. It also shows the different components of the deflection. Figure A-8 shows the curvature of the beam for each of the panels. This was calculated for the damage indices. Figures A-9 to A-14 are photos of the beam taken at various stages of the test. These all show the crack pattern of the beam when it is loaded to the given ductility.
Figure A-8. Curvature of each of the panels.
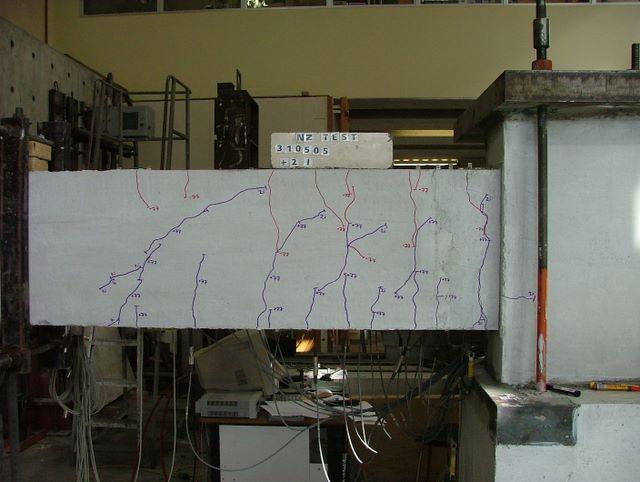
Figure A-9. Crack pattern after the first positive cycle at ductility 2
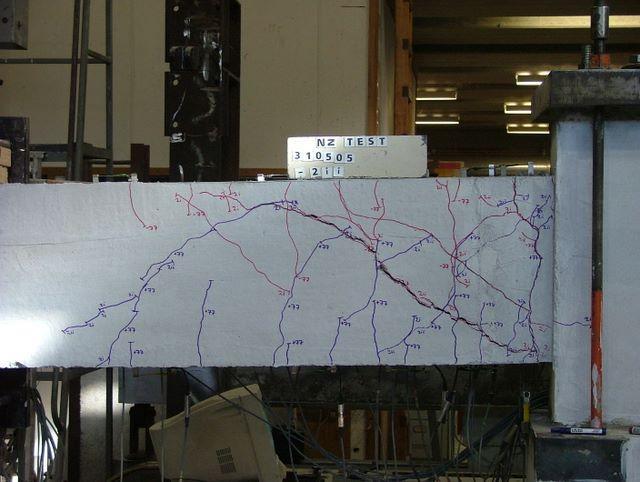
Figure A-10. Crack pattern after the last cycle at ductility 2. It also show the development of the shear crack
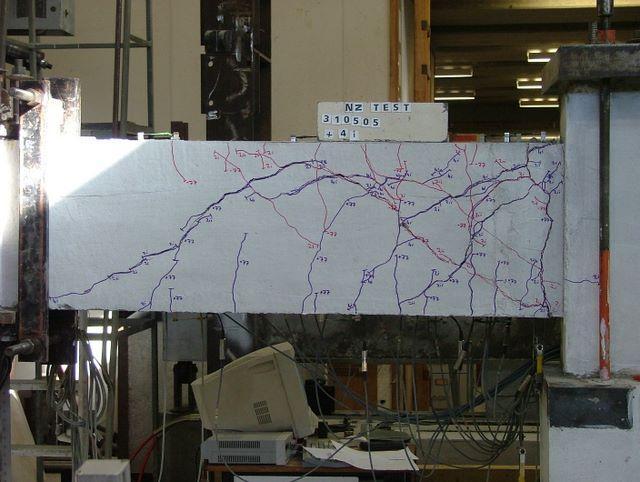
Figure A-11. Crack pattern after the first positive cycle at ductility 4
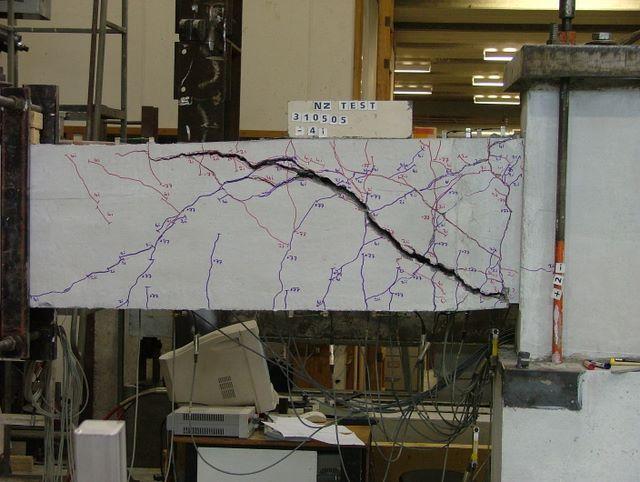
Figure A-12. Crack pattern after the first negative cycle at ductility 4
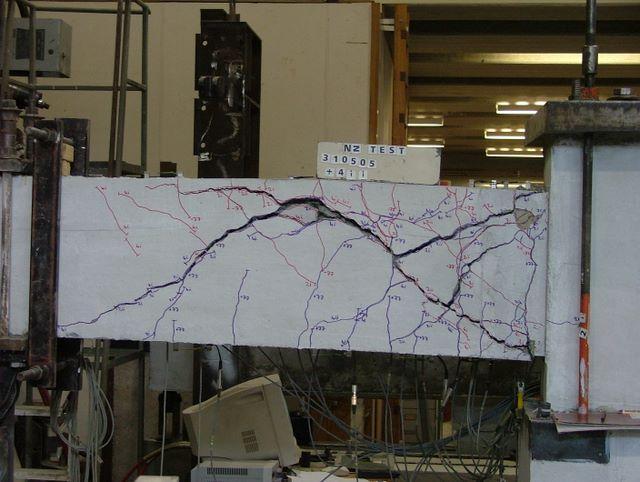
Figure A-13. Crack pattern at failure of the beam.
A-2 Public Works Research Institute Loading History
The following Figures show the response of the beam and photos at critical cycles during the testing sequence. Figures A-14 through A-20 show the elongation, increase in depth, panel shear, shear displacement, flexure displacement loading history and curvature respectively. Figures A-21 through A-26 show photographs taken during different stages of the tests.
Figures A-21 show the crack patterns after completion of loading to Ductility 0.5. The cracks are all flexural. Figures A-22 and A-23 show cycling at Ductility 1. Shear cracks have formed and have increased in size between Figure A-22 and Figure A-23. Figures A-24 and A-25 show that number of cycles can contribute to the amount of observed damage. It can be seen that the cracks are larger and there is a greater number of them in Figure A-25. Spalling which has occurred while cycling a Ductility 1 can also be seen in Figure A-25. Failure is shown in Figure A-26 and the cracks are significant in both positive and negative directions. It can also be noted that the crack patterns are very symmetrical in both the positive and negative directions.
Figure A-20 Panel Curvature
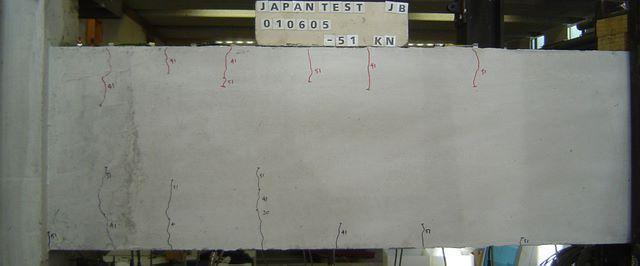
Figure A-21 After Cycling to Ductility 0.5
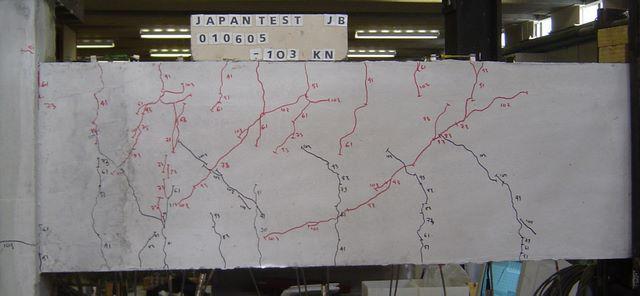
Figure A-22 After Cycling to Ductility 1
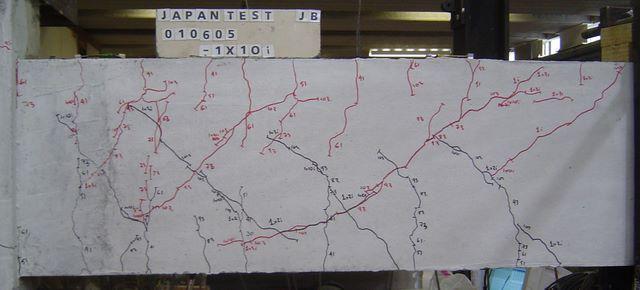
Figure A-23 After Cycling at Ductility 1 ten times
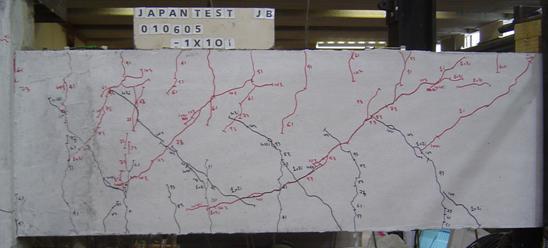
Figure A-24 After Cycling to Ductility 2
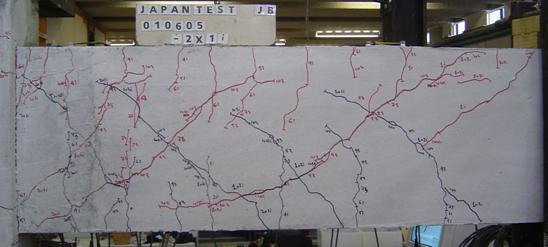
Figure A-25 After Cycling at Ductility 2 ten times
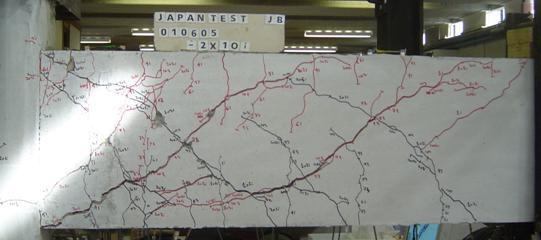
Figure A-26 After Cycling at Ductility 3 twice
A-3 The PRESSS Loading History Test
In the following pages are a number of graphs that were produced as part of the analysis conducted for the test conducted to the PRESSS loading history. Figure A-27 shows the elongation of the beam and Figure A-28 shows the increase in depth of the beam for each of the individual panels. Figure A-29 shows the shear deflection for each of the individual panels. Panels 2 and 4 had the most significant contribution to the shear deflection. The end panel (panel 5) also experienced quite a high level of deflection in the positive direction. Figures A-30 and A-31 shows the total shear and flexural deflection respectively. Figure A-32 shows the comparison of the calculated deflection and the actual deflection in the form of the loading history. It also shows the different components of the deflection. The total deflection is comprised of very little rocking deflection, which is ideal as it allows the loading history to be more accurately followed. Figure A-33 shows the curvature of the beam for each of the panels. This was calculated for the damage indices.
Figures A-34 to A-39 are photos of the beam taken at various stages of the test. These all show the crack pattern of the beam when it is loaded to the given ductility.
Figure A-34 The crack pattern at the first positive cycle of 0.25% inter-story drift (ductility of 0.44)
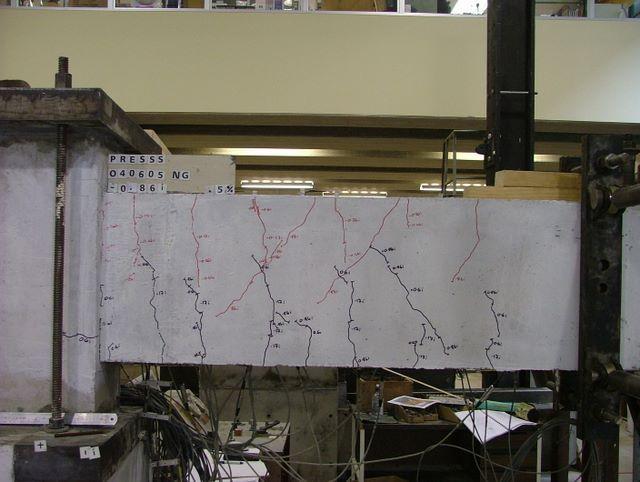
Figure A-35 The crack pattern at the first negative cycle of 0.5% inter-story drift (ductility of 0.86)
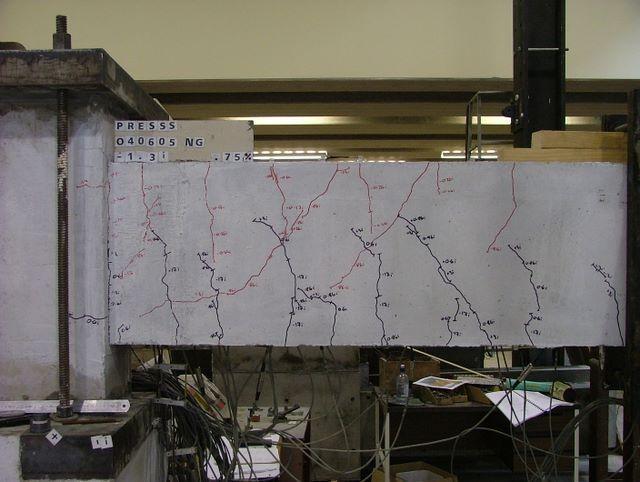
Figure A-36 The crack pattern at the first negative cycle of 0.75% inter-story drift (ductility of 1.3)
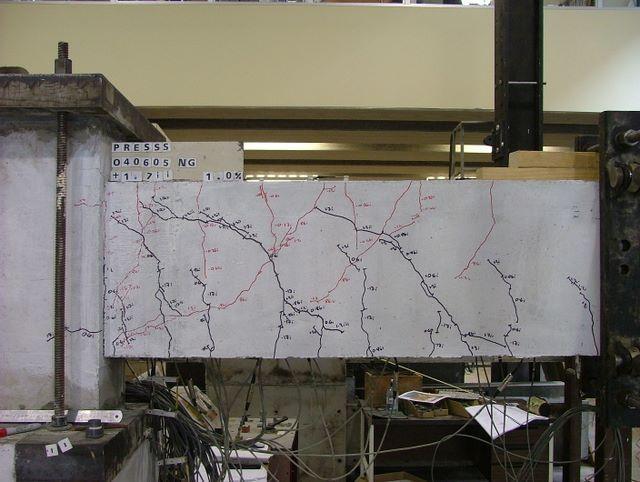
Figure A-37 The crack pattern at the second positive cycle of 1.0% inter-story drift (ductility of 1.7)
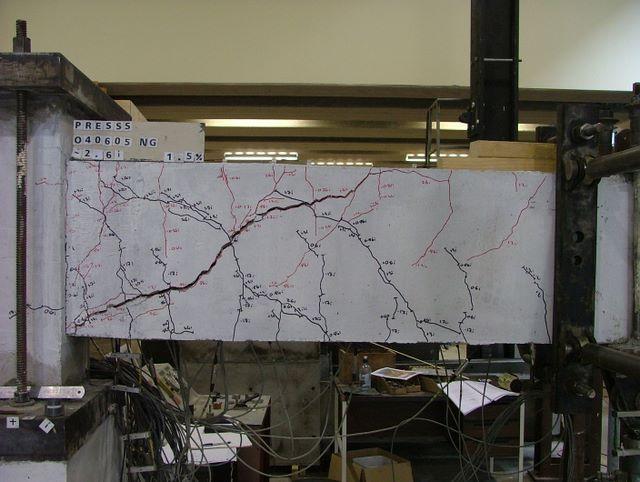
Figure A-38 The crack pattern at the first negative cycle of 1.5% inter-story drift (ductility of 2.6)
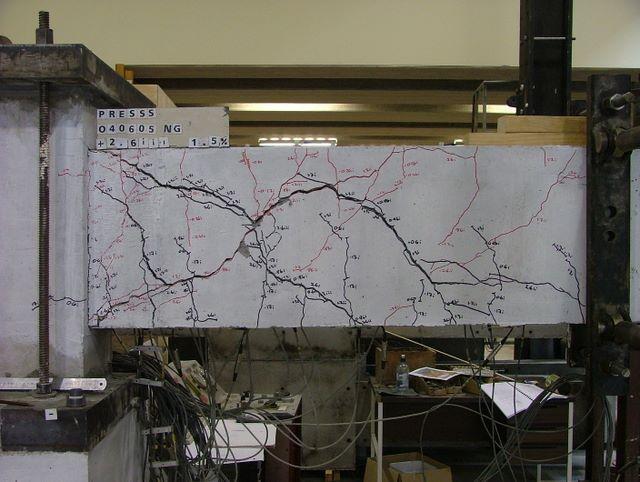
Figure A-39 The crack pattern at failure of the beam
A-4 The Berkeley Loading History Test
The following pages show the response of the beam and photos at critical cycles during the testing sequence using the Berkeley loading history.
Figure A-40 shows the total elongation of the beam and Figure A-41 shows the increase in depth of the beam for the individual panels. As was observed for all of the tests the central three panels show the most increase in depth due to the formation of a number of major shear cracks during the testing process. Figure A-42 shows the shear deflection for the individual panels showing the central three panels giving the most deflection. Figures A-43 and A-44 show the total combined shear and flexural displacements respectively. It was observed that at higher loads during the end of the test the shear displacement is becoming more and more dominant over the shear displacement. Figure A-45 shows the comparison of the actual measured displacement with the individual and combined calculated components of displacement. Figure A-46 shows the Moment-Curvature response for the individual panels. Figures A-47 to A-52 are the photos throughout the testing process where Figure A-51 is the photo of the beam at the end of cycle 27 corresponding to the beams failure.
Figure A-46 Moment-Curvature response of individual panels for Berkeley test
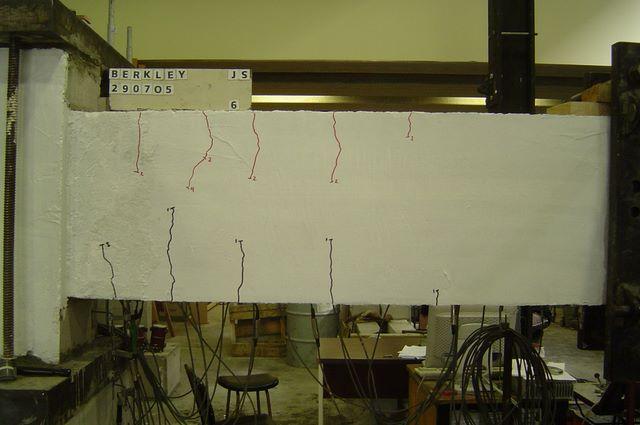
Figure A-47 Photograph after cycle 6 of Berkeley test
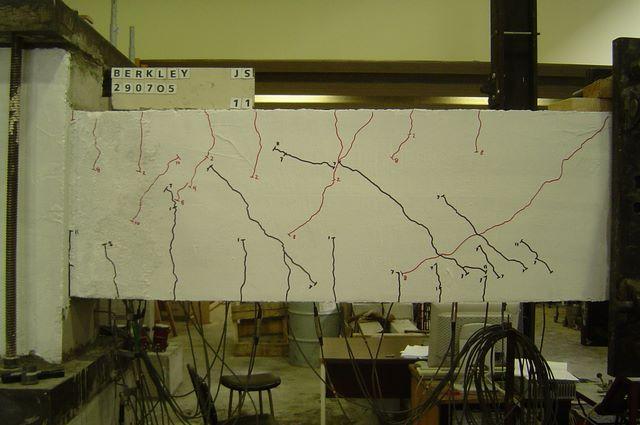
Figure A-48 Photograph after cycle 11 of Berkeley test
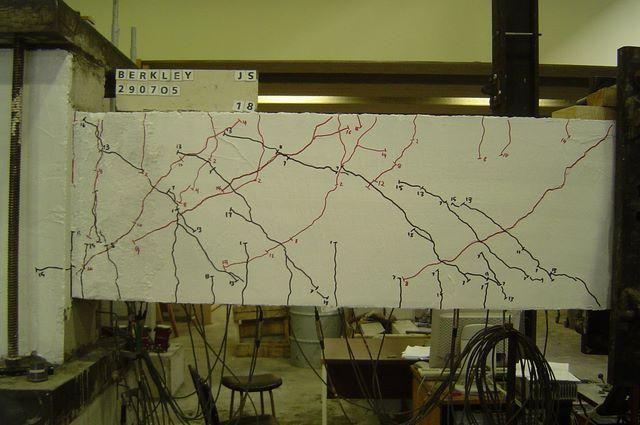
Figure A-49 Photograph after cycle 18 of Berkeley test
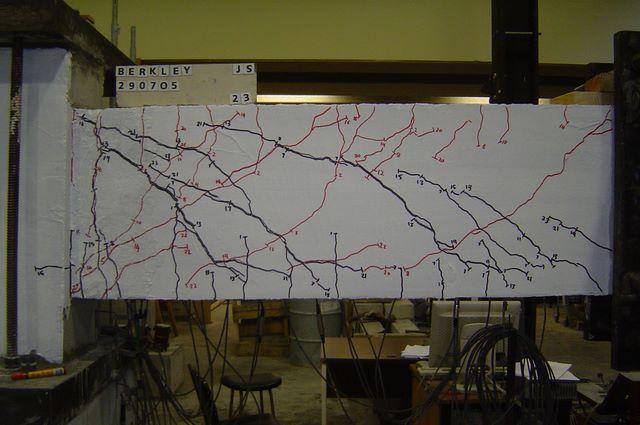
Figure A-50 Photograph after cycle 23 of Berkeley test
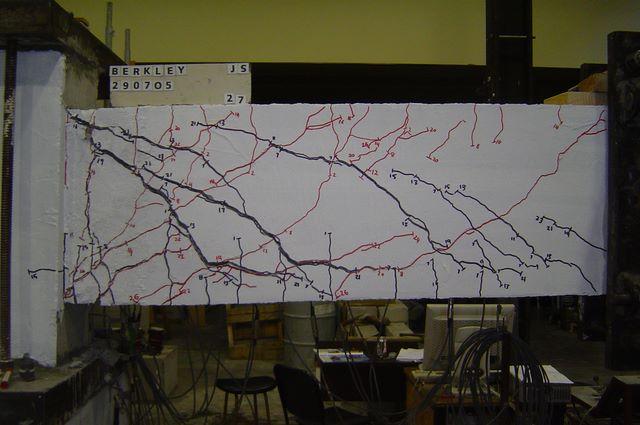
Figure A-51 Photograph after cycle 27 of Berkeley test – At failure
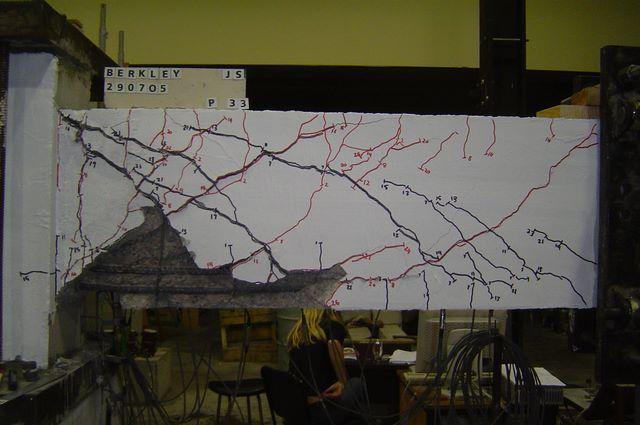
Figure A-52 Photograph after cycle 33 of Berkeley test
A-5 Monotonic Loading
The following Figures show the response of the beam and photos at critical cycles during the testing sequence. Figure A-53 through A-59 show the elongation, increase in depth, panel shear, shear displacement, flexural displacement, loading history and curvature respectively. Figure A-60 through A-65 show photographs taken during different stages of the tests.
The horizontal elongation of the beam centreline was recorded throughout the duration of the test. Figure A-53 displays the elongation recorded during the test and reveals a maximum horizontal elongation of 3.3mm.
A-6 Cycling at Ductility 3
The following Figures show the response of the beam and photos at critical cycles during the testing sequence. Figure A-66 through A-72 show the elongation, increase in depth, panel shear, shear displacement, flexure displacement loading history and curvature respectively. Figures A-73 through A-78 show photographs taken during different stages of the tests.
Figures A-73 and A-74 show the crack patterns after completion of loading to Ductility 3 in both the positive and negative direction. We can see in both figures shear cracks radiating at between 25º and 45º and flexural cracks which are almost vertical. The width of the cracks are similar within 1-2 mm however the length of the shear cracks is significantly longer. After the completion of the second Ductility 3 cycle, Figures A-75 and A-76 show a significant increase in the width of the shear cracks. The flexural cracks have not increased in length or width since Figures A-73 and A-74. Figure A-77 shows an increase in the width of the shear cracks, especially the ones further away from the column face. After failure it can be seen in Figure A-78 that there is three significant positive (black) shear cracks which are the primarily cause of failure.
Figure A-72 Panel Curvature
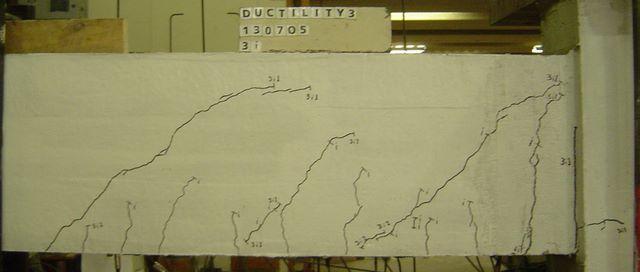
Figure A-73 First Positive Ductility 3 Cycle
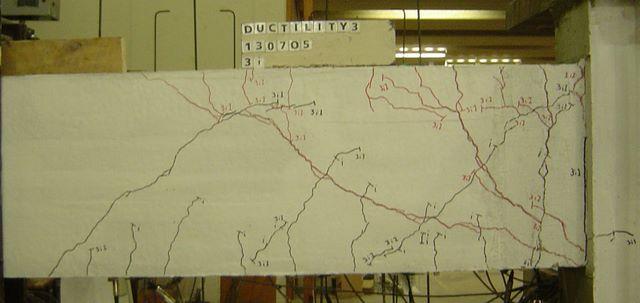
Figure A-74 First Negative Ductility 3 Cycle
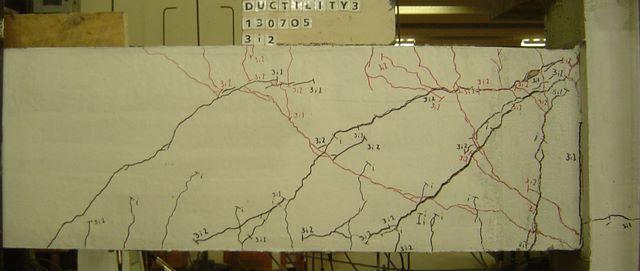
Figure A-75 Second Positive Ductility 3 Cycle
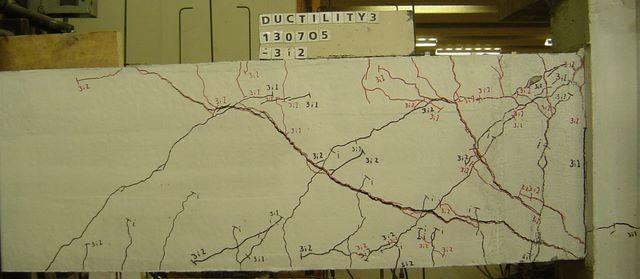
Figure A-76 Second Negative Ductility 3 Cycle
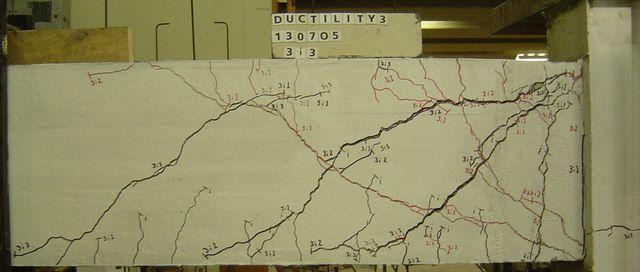
Figure A-77 Third Positive Ductility 3 Cycle
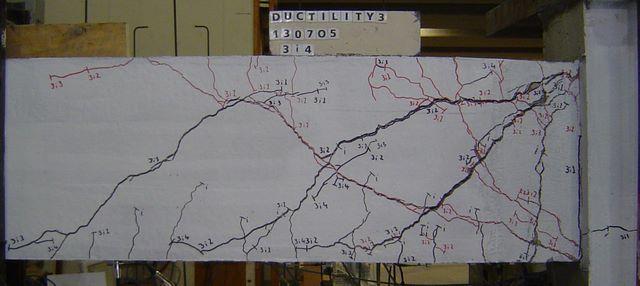
Figure A-78 Failure - Fourth Positive Ductility 3 Cycle
A-7 The Uni-directional Cycling Loading History
In the following pages are a number of graphs that were produced as part of the analysis conducted for the test conducted to the New Zealand loading history. Figure A-79 shows the elongation of the beam and Figure A-80 shows the increase in depth of the beam for each of the individual panels. Figure A-81 shows the shear deflection for each of the individual panels. Figures A-82 and A-83 shows the total shear and flexural deflection respectively. This test has a very large component of flexural deflection. Figure A-84 shows the comparison of the calculated deflection and the actual deflection in the form of the loading history. It also shows the different components of the deflection. Figure A-85 shows the curvature of the beam for each of the panels. This was calculated for the damage indices.
Figures A-86 to A-91 are photos of the beam taken at various stages of the test. These all show the crack pattern of the beam when it is loaded to the given ductility. As the test nears the end the flexural cracks becomes the site for a significant number of shear cracks to form.
Figure A-85. Curvature of each of the panels.
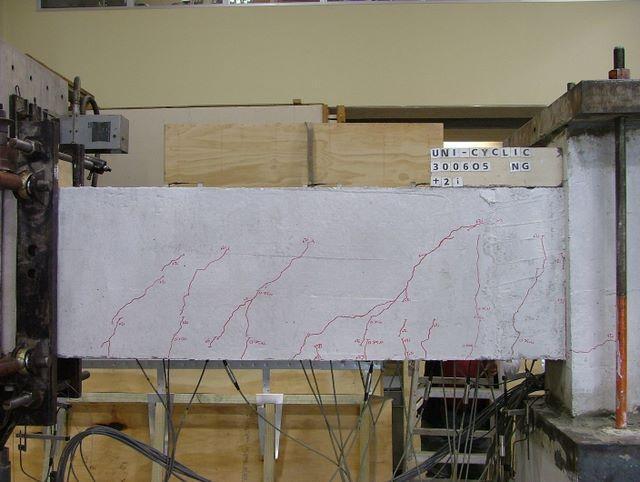
Figure A-86. Crack pattern at the first cycle of ductility 2
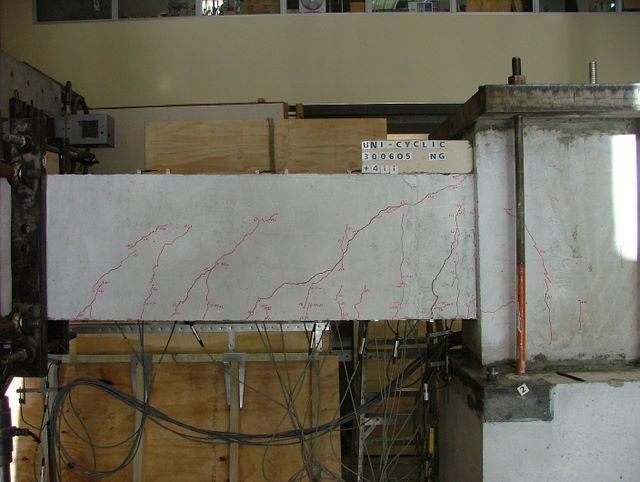
Figure A-87. Crack pattern at the second cycle of ductility 4
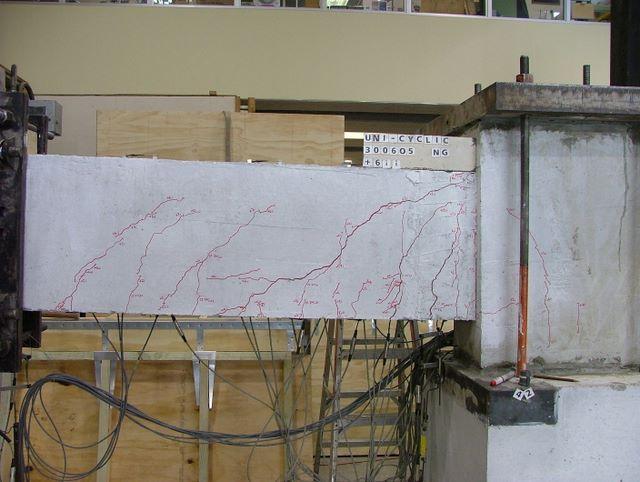
Figure A-88. Crack pattern at the second cycle of ductility 6
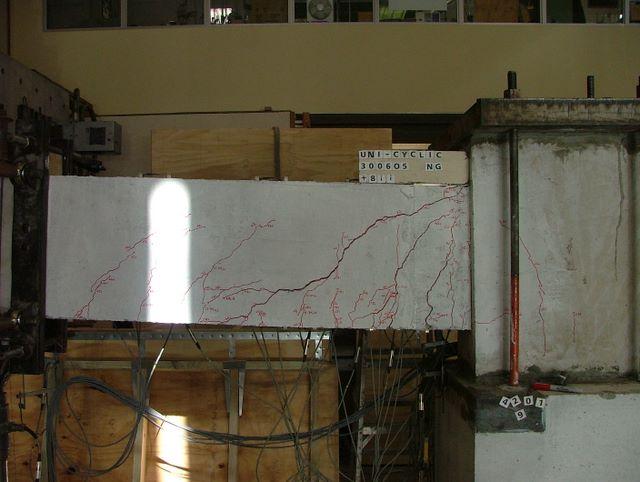
Figure A-89. Crack pattern at the second cycle of ductility 8
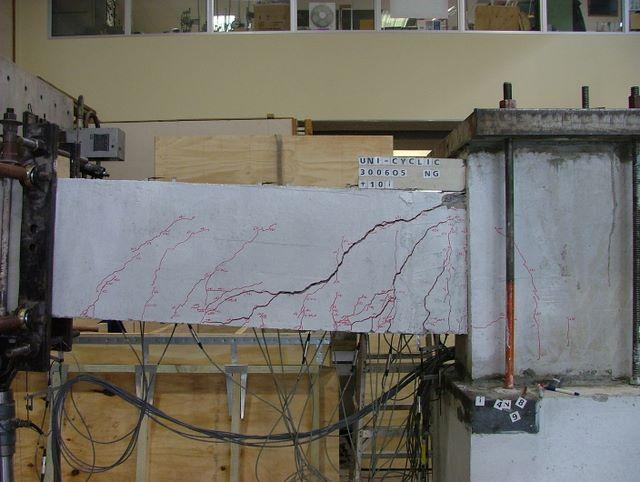
Figure A-90. Crack pattern at the first cycle of ductility 10
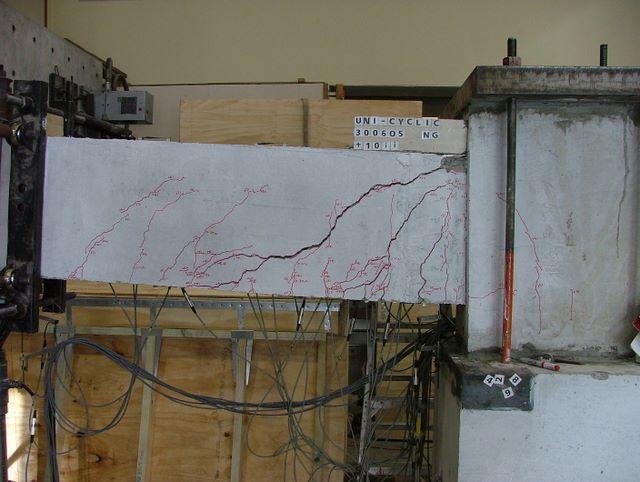
Figure A-91. Crack pattern at failure of the beam
A-9 Earthquake A Loading History
The following Figures show the response of the beam and photos at critical cycles during the testing sequence. Figure A-92 through A-98 show the elongation, increase in depth, panel shear, shear displacement, flexural displacement, loading history and curvature respectively. Figure A-99 through A-104 show photographs taken during different stages of the tests.
The horizontal elongation of the beam centreline was recorded throughout the duration of the test. Figure A-92 displays the elongation recorded during the test and reveals a maximum horizontal elongation of 6mm, the vertical displacement is skewed to the positive as a result of the displacement being centred about a point other than at rest, at zero displacement.
Figure A-93 displays the recorded increase in beam depth during testing. It shows that the maximum depth increases occurred in Panels 2, 3 & 4, this was as expected as this was where the plastic hinge and largest shear cracks formed .
A-10 Acceleration B Loading History
The following Figures show the response of the beam and photos at critical cycles during the testing sequence. Figures A-105 through A-111 show the elongation, increase in depth, panel shear, shear displacement, flexure displacement loading history and curvature respectively. Figures A-112 through A-117 show photographs taken during different stages of the tests.
Figures A-8 show the crack patterns after completion of loading to Ductility 0.3 and -0.8. From this we can see that the cracks begin as flexural and as the forces get larger they become shear dominated. Figures A-112 and A-113 show the shear cracks growing and failure in Figure A-114. We can see in both figures that there are many small shear and flexural cracks. The primary positive (black) shear crack is closest to the column. Failure is seen in A-115 after cycle 6 where the cumulative ductility is very low at 17.2. The confining shear reinforcement has failed resulting in one singular shear crack. Spalling of the large amounts of top cover concrete can also be observed. Figure A-116 shows cycle 7 where more large shear cracks can be seen forming. Figure A-117 shows that after the end of the earthquake, when the load is removed, there are numerous large cracks and significant spalling.
Figure A-111 Panel Curvature
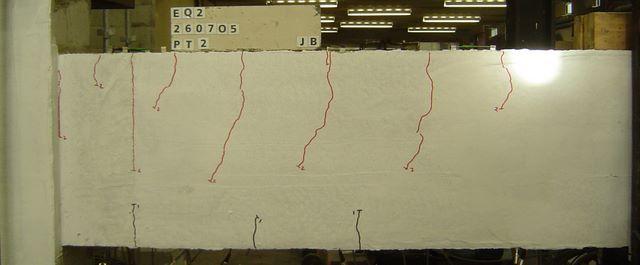
Figure A-112 Cycle 2
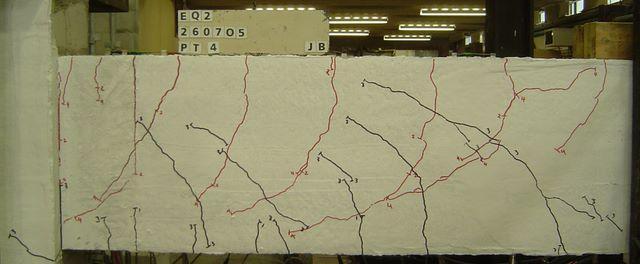
Figure A-113 Cycle 4
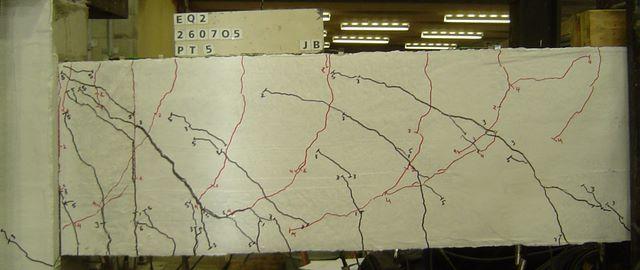
Figure A-114 Cycle 5
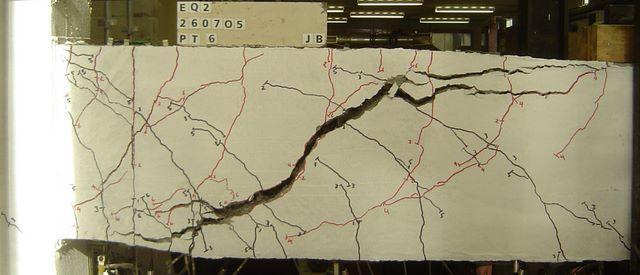
Figure A-115 Failure - Cycle 6
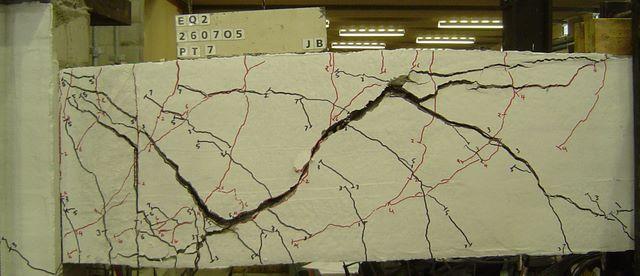
Figure A-116 Cycle 7
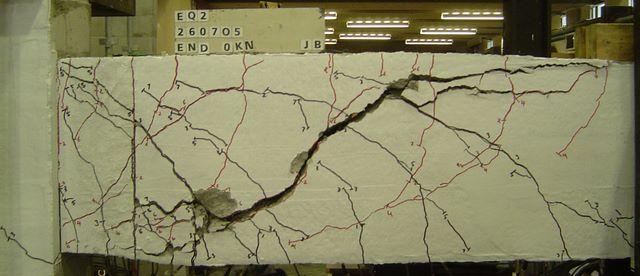
Figure A-117 Beam after completion of earthquake simulation
A-11 Earthquake C Loading History
The following Figures show the response of the beam and photos at critical cycles during the testing sequence. Figure A-118 through A-123 show the elongation, increase in depth, panel shear, shear displacement, flexural displacement, loading history and curvature respectively. Figure A-124 through A-129 show photographs taken during different stages of the tests.
The horizontal elongation of the beam centreline was recorded throughout the duration of the test. Figure A-118 displays the elongation recorded during the test and reveals a maximum horizontal elongation of 2.3mm, which is much lower than those recorded during the application of the other loading histories. This is due to the low maximum vertical displacements that were induced and hence the lack of large cracks developing.
A-11 Acceleration History D
The following pages show the response of the beam and photos at critical stages during the testing earthquake D loading history.
Figure A-131 shows the total elongation of the beam and Figure A-132 shows the increase in depth of the beam for the individual panels. As was observed for all of the tests the central three panels show the most increase in depth due to the formation of a number of major shear cracks during the testing process. Figure A-133 shows the shear deflection for the individual panels showing the central three panels giving the most deflection. Figures A-134 and A-135 show the total combined shear and flexural displacements respectively. It was observed that at higher loads during the end of the test the shear displacement is becoming more and more dominant over the shear displacement. Figure A-136 shows the comparison of the actual measured displacement with the individual and combined calculated components of displacement. Figure A-137 shows the Moment-Curvature response for the individual panels. Figures A-138 to A-143 are the photos throughout the testing process where Figure A-139 is the photo of the beam at the end of cycle 13 after a large negative displacement corresponding to approximately a displacement ductility of 6.5 causing the beams failure.
Figure A-137 Moment-Curvature response of individual panels for earthquake D loading history
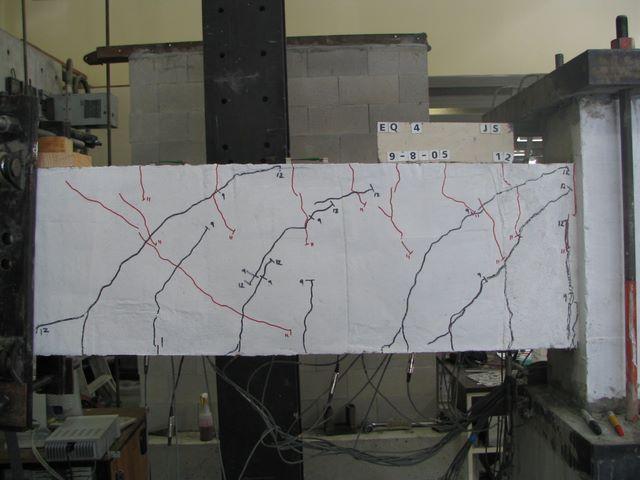
Figure A-138 Photograph of beam after cycle 6 of the earthquake D loading history
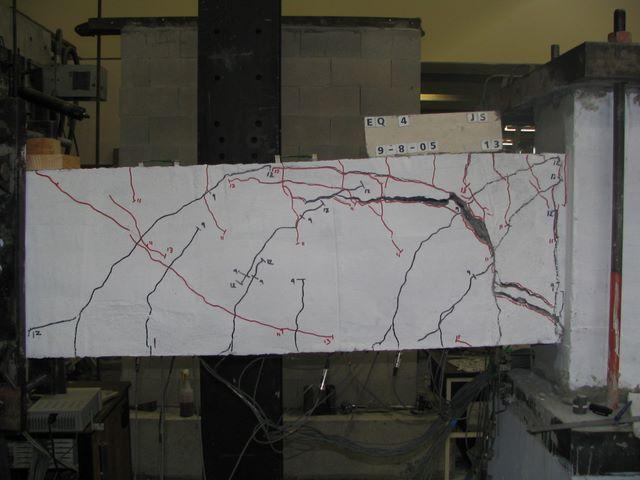
Figure A-139 Photograph after cycle 13 of the earthquake D loading history
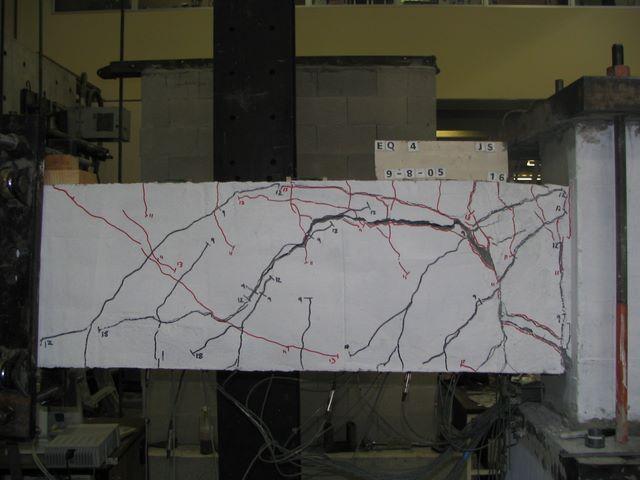
Figure A-140 Photograph after cycle 16 of the earthquake D loading history
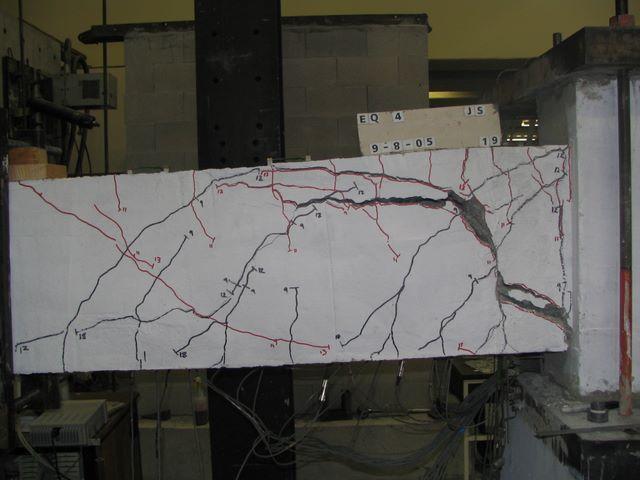
Figure A-141 Photograph after cycle 19 of the earthquake D loading history
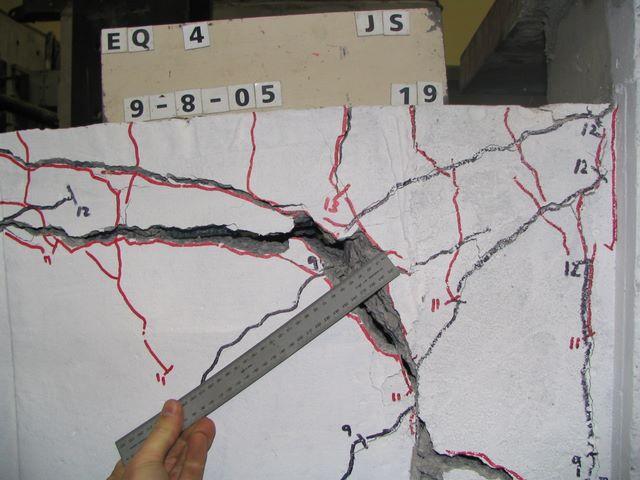
Figure A-142 Photograph of crack size and spalling after cycle 19 of earthquake D loading history
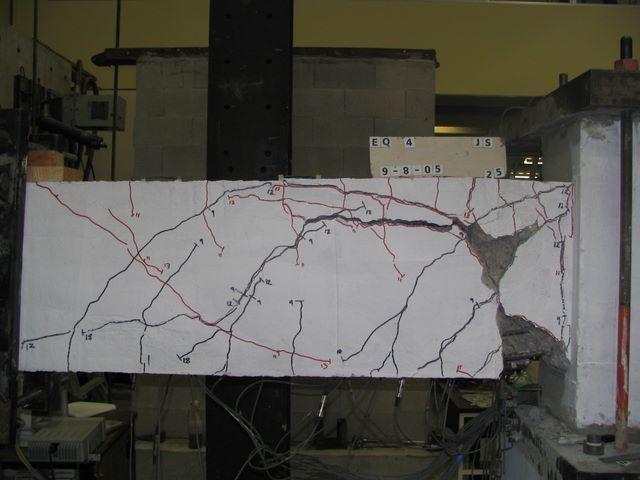
Figure A-143 Photograph at end of earthquake D loading history
A-12 Acceleration History E
The following pages show the response of the beam and photos at critical stages during the testing earthquake E loading history.
Figure A-144 shows the total elongation of the beam and Figure A-145 shows the increase in depth of the beam for the individual panels. As was observed for all of the tests the central three panels show the most increase in depth due to the formation of a number of major shear cracks during the testing process. Figure A-146 shows the shear deflection for the individual panels showing the central three panels giving the most deflection. Figures A-147 and A-148 show the total combined shear and flexural displacements respectively. It was observed that at higher loads during the end of the test the shear displacement is becoming more and more dominant over the shear displacement. Figure A-149 shows the comparison of the actual measured displacement with the individual and combined calculated components of displacement. Figure A-150 shows the Moment-Curvature response for the individual panels. Figures A-151 to A-156 are the photos throughout the testing process where Figure A-156 is the photo of the beam at the end of the loading history sequence where the beam has only just reached its failure point.
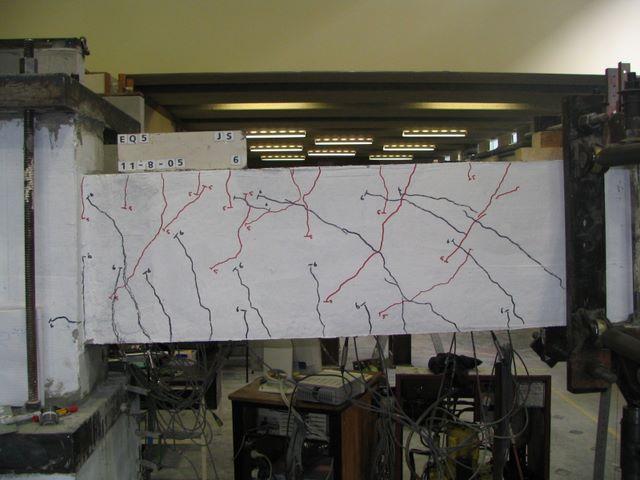
Figure A-151 Photograph after cycle 6 of earthquake E loading history
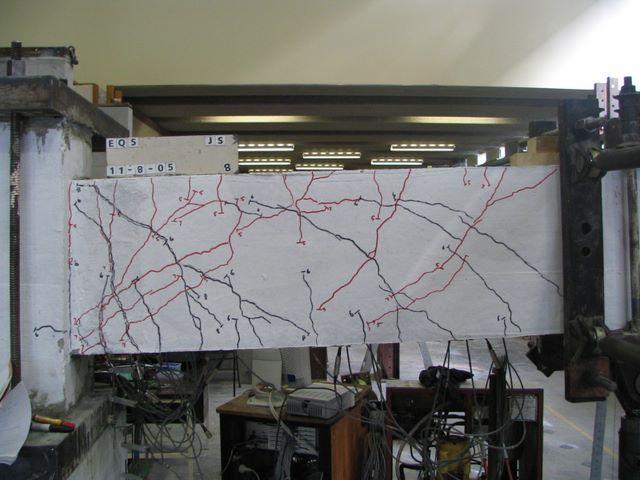
Figure A-152 Photograph after cycle 8 of earthquake E loading history
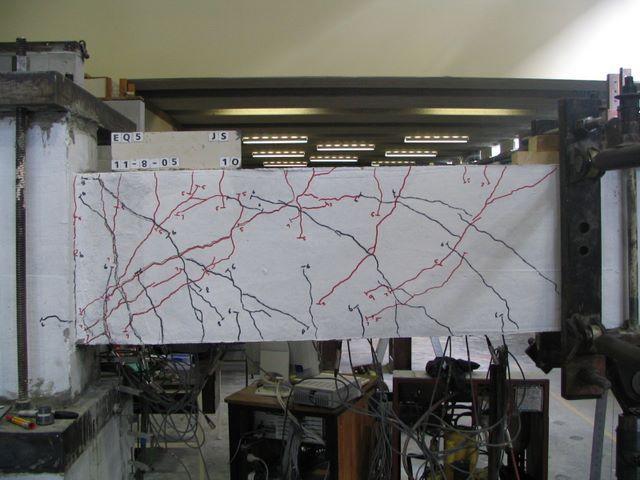
Figure A-153 Photograph after cycle 10 of earthquake E loading history
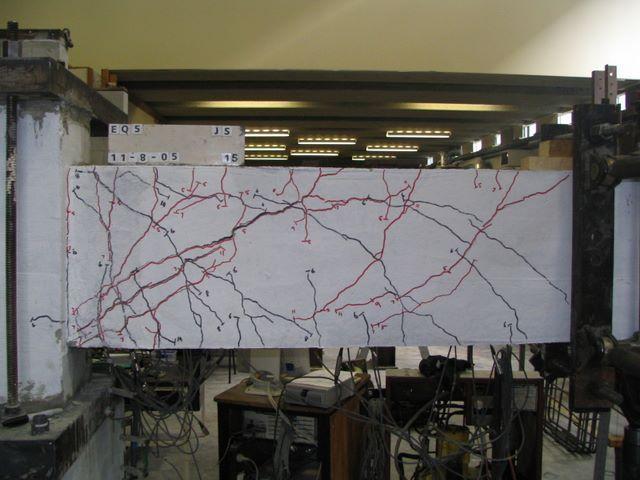
Figure A-154 Photograph after cycle 15 of earthquake E loading history
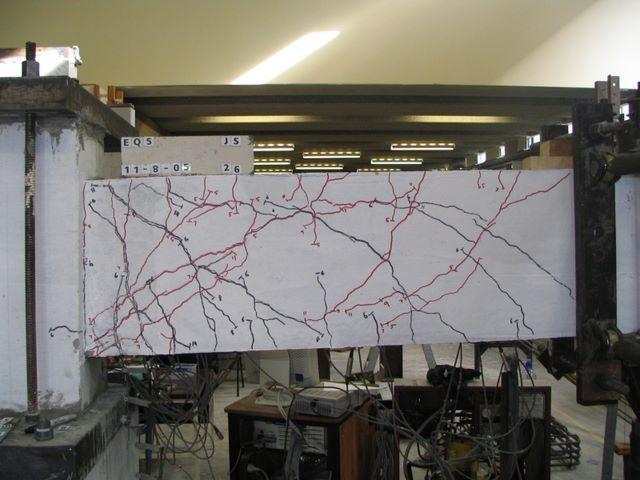
Figure A-155 Photograph after cycle 26 of earthquake E loading history
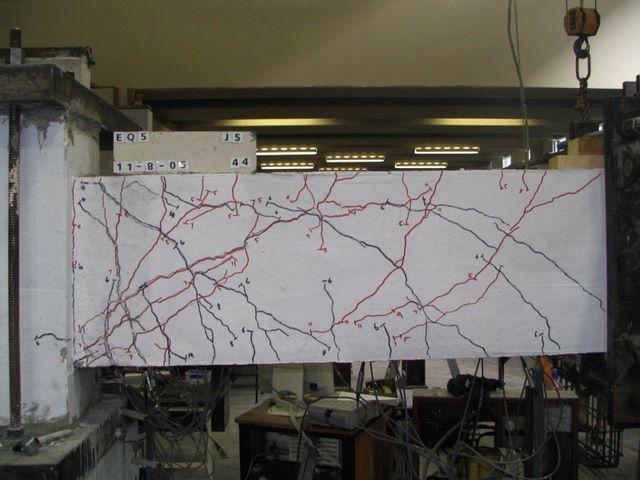
Figure A-156 Photograph after cycle 44 of earthquake E loading history


